Comparing the Potential of Hydrocarbon Generation of Kazhdomi and Pabdeh Formations in Bangestan Anticline (Zagros Basin) According To Rock-Eval Pyrolysis Data
Received: 08-Jun-2013 / Accepted Date: 15-Sep-2017 / Published Date: 23-Sep-2013 DOI: 10.4172/2157-7617.1000157
Abstract
In this study, the Hydrocarbon generation Potential of Kazhdomi and Pabdeh formation in Bangestan Anticline has been studied. In this regard, 10 samples were collected from Pabdeh formation, and 6 samples were collected from Kazhdomi formation that eventually was analyzed by Rock-Eval 6 system. In this system, a temperature raising program in oxygen-free environment was used. This device introduces a series of valuable factors related to Source rock, including: available free hydrocarbon in sample (Peak S1), hydrocarbons emanated From thermal cracking of Kerogen (Peak S2), heat index of organic matter (Tmax), Total Organic Carbon (TOC), Hydrogen Index (HI), Oxygen Index (OI), and Production Index (PI). Applying these factors, there factors of evaluating source rock could be identified, which included amount, type and thermal maturity of organic material. Kerogen of Kazhdomi Formation was type II, and Kerogen of Pabdeh Formation was defined type II and III. Studied showed that Kazhdomi Formation compared with Pabdeh Formation had more oil-generation potential. Sedimentary Facies of Pabdeh Formation was defined C, CD, D and sedimentary Facies of Kazhdomi formation was defined AB, B, BC, and C. The amount of inter organic carbon of Pabdeh formation was estimated 0.9769 weight percent (WP), and this amount for Pabdeh formation was about 0.3957 weight percent (WP). Determination of hydrocarbon absorption by Rock matrix showed that absorption rate in samples of Kazhdomi formation was much more than samples of Pabdeh Formation, which indicates that Rock matrix in Kazhdomi formation involves much more clay mineral compared with Pabdeh formation.
Keywords: Rock-Eval pyrolysis; Pabdeh formation; Kazhdomi formation; Bangestan anticline; Total organic carbon
Introduction
Comparison of source rocks, relating to different eras and determination of hydrocarbon generation potential appeared as outcrop in this region rarely has been done. In recent years, using different geochemical methods and theories, lots of improvements relating to source rocks, immigration or oil accumulation have been achieved. One of the main conditions of Formation and accumulation of hydrocarbon in a subterranean reservoir, is existence of source rock with enough extent, thickness and, sufficient maturity. In the present study, hydrocarbon generation potential and thermal maturity of Pabdeh and Kazhdomi Formation in Bangestan Anticline has been done. One of the main instruments used for improving analysis precision of geochemical studies is Rock-Eval 6 system, which is the latest generation [1]. This system can evaluate hydrocarbon generation, and also reduces the risk of drilling [2]. Also in this study the Rock-Eval system has been utilized for evaluation of sample in Pabdeh and Kazhdomi formations, it is required to use available results in order to determine the possibility of being source rock in one of above mentioned Formation in this region is more.
Geology of Bangestan Anticline
Studied region is located in Bangestan anticline in 30 Km off Behbahan, Khuzestan province, near the village Likak PA, North West. Approximate dimensions of this anticline are 32 Km of length and 7 Km of with along the general direction of Zagros basin. The procedure of tectonic structure in region is towards North West-southeast, which is consistent with general direction of Zagros basin. According to Stoecklin [3], this area is a part of folded Zagros Zone. In this study samples relating to Kazhdomi Formation from Location 2, situated in Tange-Maghar Were collected (Figure 1). Pabdeh Formation (related to Paleocene-Eocene age) included marl, limestone shale’s and clay limestone [4]. Kazhdomi Formation (related to Albian-Cenomanian age) includes dark-gray shale’s (and occasionally black) with layers of dark clay limestone and marl. Both of these Formations are involved among major source rocks in Zagros sedimentary basin [5].
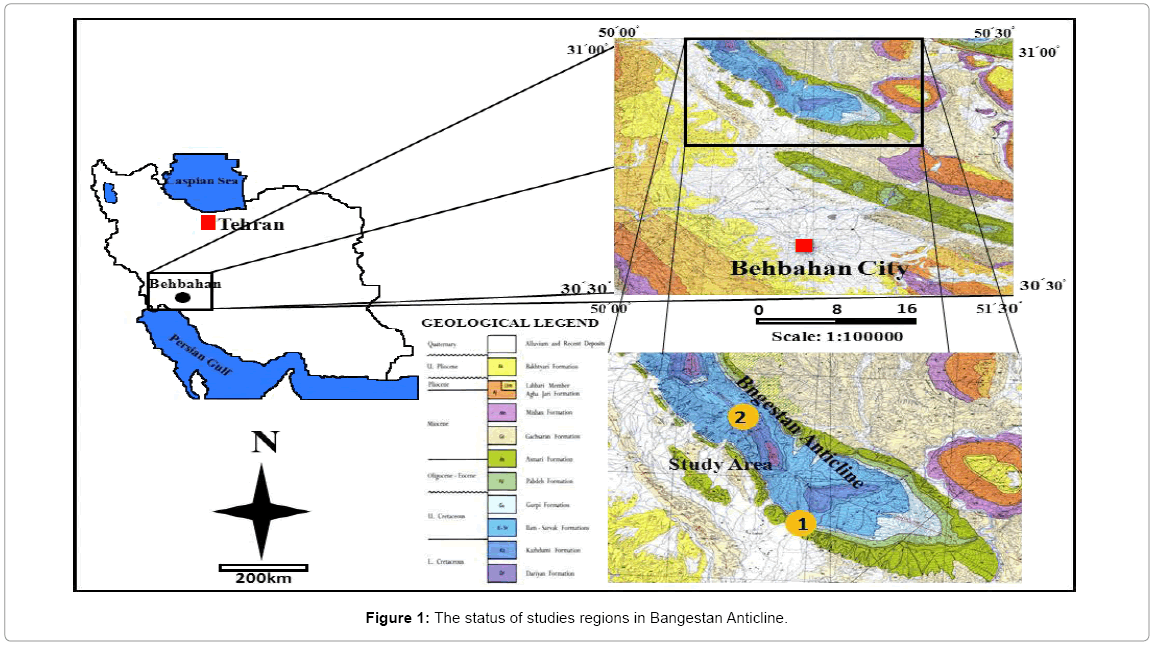
Figure 1: The status of studies regions in Bangestan Anticline.
Methodology
In order of studying either of these formations 16 samples was collected, which 10 out of 10 samples from Pabdeh Formation were from Tange-Ban, and 6 remaining sample: of Kazhdomi Formation were from Tange-Maghar in Bangestan anticline (Figure 1). It is noteworthy to mention that collecting was done according to required standard, and from locations not subject to air. 50 to 60 mg of selected samples powdering was analyzed, using Rock-Eval 6 system in Chamran University of Ahwaz. Total Organic Carbon (TOC), type of Kerogen, type of organic Facies, type of generated hydrocarbons, and sedimentary parameters were all examined. Information obtained from this system about Kazhdomi and Pabdeh formation samples in Bangestan anticline has been displayed in Table 1. Rock-Eval 6 system as the latest generation of Rock-Eval systems has been completed by Vinci technology, which is the best device in order to evaluation of source rocks, due to its great analysis precision [1]. Parameters acquired from this analysis are as follows:
| S. No. | Fm | PI | OI | HI | TOC | Tmax | S2 | S1 |
|---|---|---|---|---|---|---|---|---|
| 1 | Pb | 0.48 | 152 | 120 | 0.4 | 434 | 0.42 | 0.39 |
| 2 | Pb | 0.6 | 139 | 125 | 0.48 | 438 | 0.38 | 0.42 |
| 3 | Pb | 0.16 | 157 | 79 | 0.39 | 426 | 0.31 | 0.06 |
| 4 | Pb | 0.12 | 149 | 227 | 0.57 | 431 | 1.58 | 0.22 |
| 5 | Pb | 0.16 | 258 | 124 | 0.59 | 440 | 0.73 | 0.14 |
| 6 | Pb | 0.36 | 66 | 45 | 0.51 | 429 | 0.23 | 0.13 |
| 7 | Pb | 0.13 | 195 | 215 | 0.41 | 393 | 1.03 | 0.16 |
| 8 | Pb | 0.13 | 158 | 197 | 0.36 | 431 | 0.71 | 0.11 |
| 9 | Pb | 0.37 | 197 | 211 | 0.43 | 435 | 0.91 | 0.53 |
| 10 | Pb | 0.46 | 79 | 77 | 35 | 425 | 0.27 | 0.23 |
| 1 | Kz | 0.01 | 60 | 125 | 1.51 | 429 | 1.89 | 0.02 |
| 2 | Kz | 0.01 | 66 | 304 | 1.15 | 428 | 3.5 | 0.02 |
| 3 | Kz | 0.02 | 40 | 376 | 1.34 | 426 | 5.04 | 0.1 |
| 4 | Kz | 0.02 | 39 | 461 | 2.34 | 421 | 10.78 | 0.23 |
| 5 | Kz | 0.03 | 24 | 607 | 2.85 | 424 | 17.31 | 0.56 |
| 6 | Kz | 0.03 | 22 | 626 | 2.75 | 424 | 17.21 | 0.58 |
Table 1: Data obtained from pyrolysis Rock-Eval 6 related to samples of Kazhdomi (Kz) and Pabdeh (Pb) formation (Fm) in Bangestan Anticline.
S1: indicates the amount of free hydrocarbons evaporated in a temperature about 300°C, and is determined by unit of per mg hydrocarbon in per gram of stone (mg HC/g Rock).
S2: indicates the amount of hydrocarbon and oxygen rich compounds that release in a temperature about 300 to 650°C due to thermal cracking of Kerogen and heavier compounds (much more dense) such as resin and asphalthene compounds. S2 Peak is, In fact, the available potential in stone sample which is determined by the unit of (mg HC/g Rock) in per gram of Rock.
S3: Indicates oxygen rich compounds decomposing in a temperature about 390°C, and results in release of CO2 gas. S3 peak is which is determined by the unit of (mg HC/g Rock) in per gram of Rock.
S3: Indicates oxygen rich compounds decomposing in a temperature about 390°C, and results in release of CO2 gas. S3 peak is determined by the unit of per mg CO2, in per gram of stone (mg CO2/g Rock).
TOC: indicates total organic carbon in samples.
Tmax: Is the temperature in which S2 Peak shows its most amounts, in the meantime, using abovementioned parameters, a series of indexes such as hydrogen Oxygen Index (OI): (S3/TOC).
Hydrogen Index (HI): Is the ratio of (S2/TOC).
Index of hydrocarbon generation potential: PI (S1/S1+S2) in studied samples could be examined [1].
The data from Rock-Eval 6 system relating to samples of Kazhdomi and Pabdeh Formations are shown in (Table 1).
Results and Discussion
According to Ala et al. [6] the Pabdeh Formationis poorerthan Kazhdomi Formation in term of organic matters, and it is not be expected to take role of a significant source rock. This formation is such an alternate of poor and rich layers of organic matters. Probably Pabdeh formation containe some not-immigrated oil [7], whereas in Kazhdomi Formation in the Dezful embayment, thermal maturity has become evident [6]. The Maximum of Total Organic Carbon (TOC) related to Kazhdomi and Pabdeh formation is 2.85 and 0.59 (Table1),respectively, which indicates higher amount of organic matters in Kazhdomi copmared with Pabdeh formation.Pabdeh formation doesnothave potential capability of a good source rock, which means hydrocarbon generation in these kind of rocks is in a very primary and preliminary phase. Light color of organic matters in this identifys that sufficient thermal maturity does not take place in these layers, and Pabdeh formation could not has generated a considerable amount of hydrocarbon as a source rock. In Pabdeh formation, there are alternate layers riched with bituminous organic matters, and also laminations lack of bitumine. The diagram pyrolysis hydrocarbon versus total organic carbon is a useful tool in order to use data obtained from Rock-Eval pyrolysis to recognize and evaluate characteristics of organic matters in a sedimentary rock.
Determination of existing hydrocarbon stability
In this study for assurance about sample not being combined with hydrocarbon matters (due to transformation of oil towards upper units), diagram (S1/TOC) an adverse effect on results of pyrolysis of Rock-Eval system, and lead to false interpretation of acquired data. In this diagram, higher values of S1 versus low values of Toc indicate combination of samples with not-being fit oil. In non-contaminated sample the maximum amount is 1.5 (S1/TOC), which is in fact slope of boundary line in diagram. Therefore, samples that are above of this line are oil-polluted and also have not-being fit hydrocarbon. Diagram of changes in S1 Versus TOC lack of hydrocarbon contamination in examined samples (Figure 2). So it can be concluded that available hydrocarbon in samples is indigenous hydrocarbons and interpretable type.
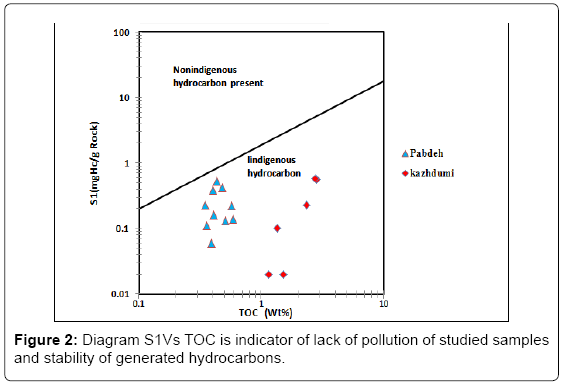
Figure 2: Diagram S1Vs TOC is indicator of lack of pollution of studied samples and stability of generated hydrocarbons.
Determination of hydrocarbon potential
Evaluation of hydrocarbon generation in Pabdeh and Kazhdomi formation as probable source rock and oil producer for Bangestan and Asmari reservoirs in Dezful embayment is of significant importance. Determination of oil potential of sedimentary units using diagram of pyrolysis hydrocarbon versus total organic carbon is one of the specific applications. The samples which their value of (S2) is more than 5mg Hc/g Rock have good potential and samples which their value is more than 15 mg Hc/g Rock or above, have good to excellent potential [8] by entering the data related to Pabdeh and Kazhdomi formation has been ranged from good to very good, and this value for Pabdeh formation ranged from weak to medium (Figure 3).Situational difference in both of these formations can be due to accumulation of organic matters, and better preserving conditions in Kazhdomi formation, and also it is dependent on the type of accumulated organic matter and its better quality in Kazhdomi formation than Pabdeh formation [9].
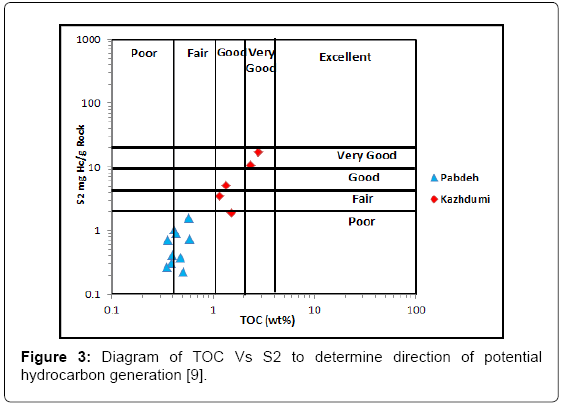
Figure 3: Diagram of TOC Vs S2 to determine direction of potential hydrocarbon generation [9].
Determination of Kerogen type
Quality or type of organic matter was specified with the aid of hydrogen index (HI) Versus Oxygen index (OI) and also diagram of Hydrocarbon index Versus Tmax (Figure 4) [2], and Kerogen type II is specified for Kazhdomi formation, while Kerogen type II and III as a blend is specified for Pabdeh formation. Espitalie and colleagues designed a diagram using hydrogen index ratios versus oxygen index. Which according to it Kerogen type I involves capability of 60 weight percent of hydrocarbon while pyrolysis, that this amount equals HI=600 mg HC for Total Organic Carbon. Kerogen type II produce about 30-60 weight-percent hydrocarbon (HI=300-600) and Kerogen type III produces 5-20 weight-percent of hydrocarbon (HI=50-200). Disrupted line which is separating boundary between Kerogen type I and II, locates in a range as HI=700, and separating line of Kerogen type II and III boundary is indicates HI=200, [10], According to diagrams considering the data about Kazhdomi and Pabdeh formations, most of sample relating to Kazhdomi formation are as the same range as Kerogen type II, and Pabdeh formation samples are as the same range as Kerogen types II and III (Figure 5). Changes in Kerogen of Pabdeh formation might be as a result of combination of land and marine sediment, and condition of sedimentation. The best source rocks of this basin been deposited in an oxygen-depleted condition in global sea level rise through Intra-shelf basin. In this period of time, the oxygen depleted condition lasted in various regions of basin for a long time. In southern part of Arabian edge resulting from erosion of shield points, a great deal of Terrigenous deposits in send (Burgan sandstone) had been placed in the basin during Cretaceous era while global rise of sea level. The higher energy parts of coastal areas and inland seas (where the generation of water column is a sufficient, but strong current of water with high content of oxygen intensify the reduction of biological and chemical TOC) are of the least support. Shallow inland seas, narrow sea routes between continents and constrained region are regarded special sedimentary environments for source beds of oil (Kerogen type III). But with forward movement of sea, condition for accumulation and preserve of organic matters became better (regenerating environment) and marine Kerogen become domination (Kerogen type II).
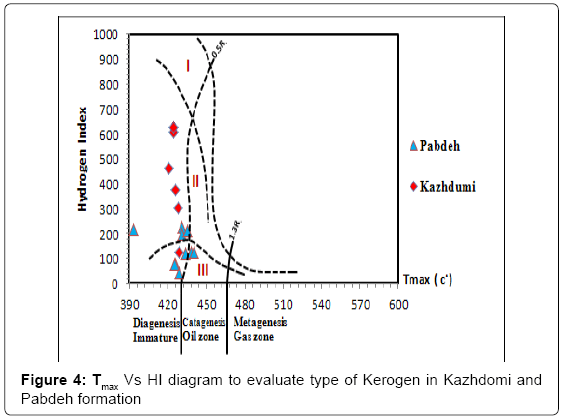
Figure 4: Tmax Vs HI diagram to evaluate type of Kerogen in Kazhdomi and Pabdeh formation
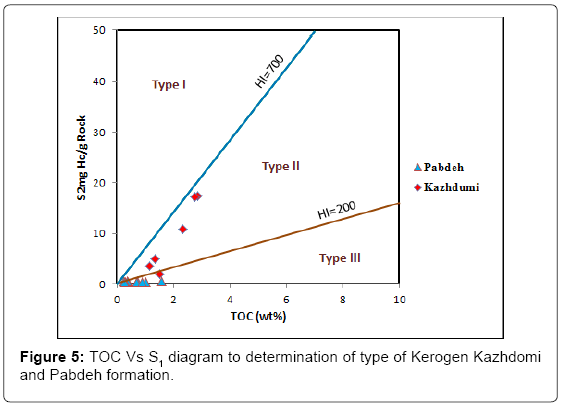
Figure 5: TOC Vs S1 diagram to determination of type of Kerogen Kazhdomi and Pabdeh formation.
Determining the amount of hydrocarbon absorption
The best source rocks in the Zagros Basin, in Pabdeh and Kazhdomi formation, have precipitated during global rise of sea level in Intershelf basin, and in oxygen free conditions. In this era, a great deal of terrigenous deposits during cretaceous had entered the basin, creating layers richen in clay and argilic limestone in Dezful embayment. Most of sediments of these two formations consist of carbonate and belong to high energy, and [11] believed that most of compounds related to Kazhdomi and Pabdeh formation Khuzestan and Lurestan provinces are in regions having more collapse than other regions. Quick precipitation and great thickness of Gachsaran and Aghajary formations caused the Pabdeh and Kazhdomi formation to reach the required thermal maturity in order of generating hydrocarbon from Miocene onwards. Orogenic of the Zagros in Miocene age had a major role in providing thermal maturity, and maturity of southern regions of Dezful embayment had been diminished due to reduction of collapse in source rock of Kazhdomi and Pabdeh formation another application of total organic carbon graph relating to pyrolysis hydrocarbons includes determination of hydrocarbon absorption rate by existing minerals in rock matrix, [2,12,13]. In the cases of lack of hydrocarbon absorption, regression lines must pass through the origin of diagram, but these lines generally collide with its x-axis and in positive direction, and this is due to the presence of Inert organic carbon, or matrix absorption effect during pyrolysis. The main cause of absorption in organic matters includes clay minerals. The effect of matrix in positive direction of x axis is specified, and status of this criterion intersection for absorption of hydrocarbon is through rock matrix (Figure 6). With regard to (Table 2), regression lines for either of formations is toward positive direction of x axis, indicating hydrocarbon absorption by matrix of source rock among them, and this value for Kazhdomi formation is 0.934 and for Pabdeh formation is 0.131 (Figure 6). Regarding above-mentioned topics, Kazhdomi formation consists of more clay compared with Pabdeh formation due to lithological conditions, and also Kazhdomi formation involves a lot more pyrolysis hydrocarbon absorption.
| Formation | Number of Sample | Equation TOC vs S2 | R2 | Contact With X axis |
|---|---|---|---|---|
| Pabdeh | 10 | Y=2.0663x–0.2708 | 0.1675 | 0.131 |
| Kazhdomi | 6 | Y=8.7971x–8.2179 | 0.9191 | 0.934 |
Table 2: Regression equations of Pabdeh and Kazhdomi formation and their parameters.
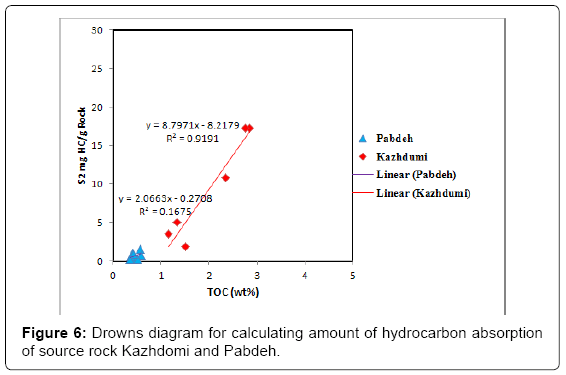
Figure 6: Drowns diagram for calculating amount of hydrocarbon absorption of source rock Kazhdomi and Pabdeh.
Determination of Inert Organic Matter
Minor Inert organic carbon from available Kerogen carbon is involved is rock sample, that in pyrolysis is measured along with organic carbon as total organic carbon. This carbon does not have any role in hydrocarbon generation potential: and is achieved by precise evaluation of organic carbon with capability of generating hydrocarbon [14]. Presence of Inert organic matter has an effective role in deviation of regression line from the origin of coordinates. This material disintegrates during pyrolysis, and with this diagram it can be recognized. Therefore, samples of Pabdeh and Kazhdomi formations were drawn, and its equation of regression line was evaluated. Intersection of this line with vertical axis for each formation represents available Inert carbon among them (Figure 7 and Table 3). According to studies by [14], regression line for most of plotted data on diagram versus amount of total organic carbon has an equation as follow, in which b indicates Inert organic carbon, and a indicates slope of regression line:
| Formation | Number of Sample | Equation TOC vs S2 | R2 | Inter carbon | Contact With X axis |
|---|---|---|---|---|---|
| Pabdeh | 10 | Y=0.0811x–0.3957 | 0.1675 | 0.3957 | –4.879 |
| Kazhdomi | 6 | Y=0.1045x–1.0196 | 0.9191 | 1.0196 | –9.756 |
Table 3: Equation of regression line, amount of inert organic carbon and parameter obtained from it for samples of Kazhdomi and Pabdeh formation.
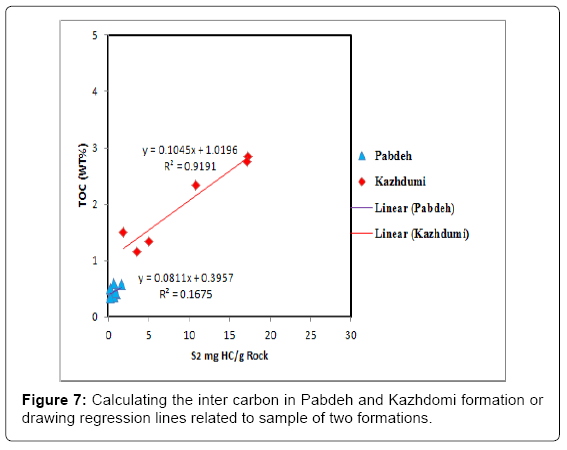
Figure 7: Calculating the inter carbon in Pabdeh and Kazhdomi formation or drawing regression lines related to sample of two formations.
TOC=aS2+b a=TOC/S2=100HI, Y=ax+b
TOC (live)=TOC (observed)-TOC (Inert)
Determination of organic facies
In order to determine studied organic facies (Figure 8), changing process of HI to OI and TOC has been utilized, [14,15]. In this diagram, according to changes of HI values versus OI values range of mentioned formation facies have been specified [16]. It is noteworthy to mention that in this diagram, Pabdeh formation stays in a variable range from facies (C, CD, D), and Kazhdomi formation stays in a more (AB, B, BC and C). The reasons of widespread changes in Kazhdomi formation can be related to environmental conditions during deposition. Jones chart indicates that sediments belong to facies C from Pabdeh formation relating to environments with medium precipitation speed rate in regenerating conditions, and facies C, CD and BC belong to environments with marine and continental organic matters and quick precipitation in relatively oxidant conditions; facies belongs to lake and marine environments which are relatively regenerating; and facies AB belongs to regenerating marine environment. Changes of TOC Versus HI illustrate that by increasing Hydrogen Index (HI), the amount of organic carbon increases, too. It indicates that organic matters preserve in regenerating conditions. Owning a variable range in Kazhdomi formation represents receding and developing in this formation, which is due to variability of environment conditions during deposition of this formation, while Pabdeh formation with a stable range of development, shows reduction of oxygen in sea water. This outcome obviously can be seen in diagram (Figure 9) [17].
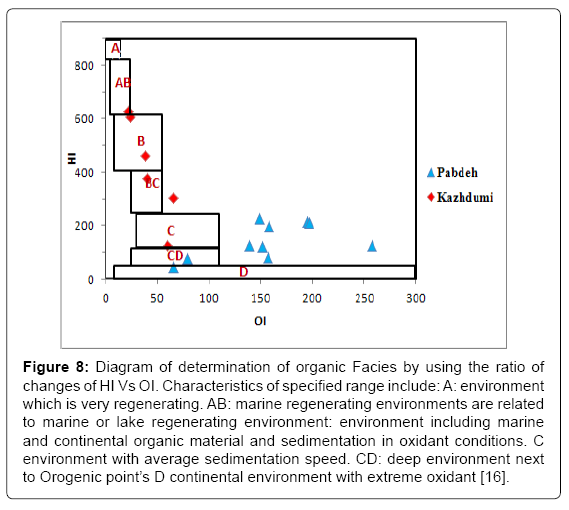
Figure 8: Diagram of determination of organic Facies by using the ratio of changes of HI Vs OI. Characteristics of specified range include: A: environment which is very regenerating. AB: marine regenerating environments are related to marine or lake regenerating environment: environment including marine and continental organic material and sedimentation in oxidant conditions. C environment with average sedimentation speed. CD: deep environment next to Orogenic point’s D continental environment with extreme oxidant [16].
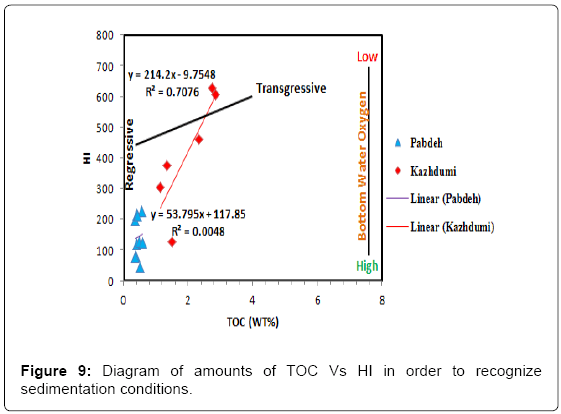
Figure 9: Diagram of amounts of TOC Vs HI in order to recognize sedimentation conditions.
Hydrocarbon generations potential
Using diagram of TOC Versus HI values, type of generated hydrocarbon by mature sample can be identified [18]. With the aid of this diagram it became evident that studied samples have the capacity of generating oil and gas; and with regard to variability of sedimentary conditions, either of these formations are capable of generating hydrocarbon in a widespread range of gas with low oil, medium oil, or good oil (Figure 10). All samples of Pabdeh and Kazhdomi formation are located in the initial Oil-generating windows, and this is because of not locating in deep burial condition (Figure 11). In case of burial, such as other Oil-generating region of south, they would locate in oil window. A sample from Pabdeh formation is distinguished from other samples, which is due to erosion of organic matters (combining with air) and can be related to a non-shale sample. To determine hydrocarbon generation potential of Pabdeh and Kazhdomi formation, diagram S1+S2 for TOC has been used which indicates that Kazhdomi formation with high values of S1+S2and TOC in Tang-e-Maghar region includes a ratio of hydrocarbon generation from good to excellent than samples of Pabdeh formation in Tang-e Ban, that is because of higher value of organic matters, more lapse of time, or more maturity (Figure 12).
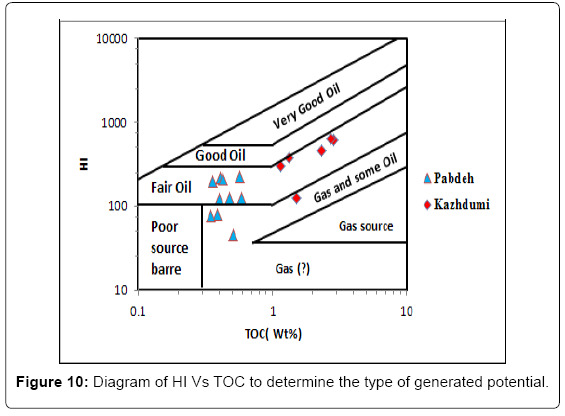
Figure 10: Diagram of HI Vs TOC to determine the type of generated potential.
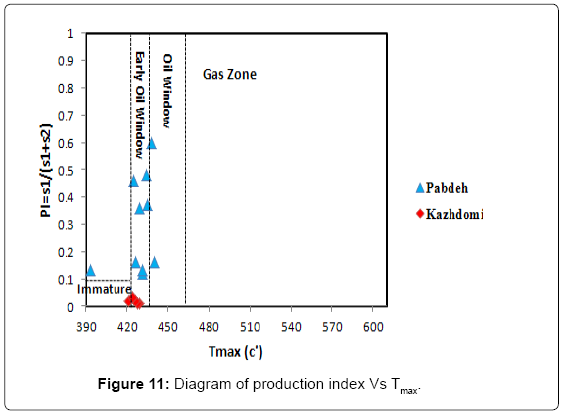
Figure 11: Diagram of production index Vs Tmax.
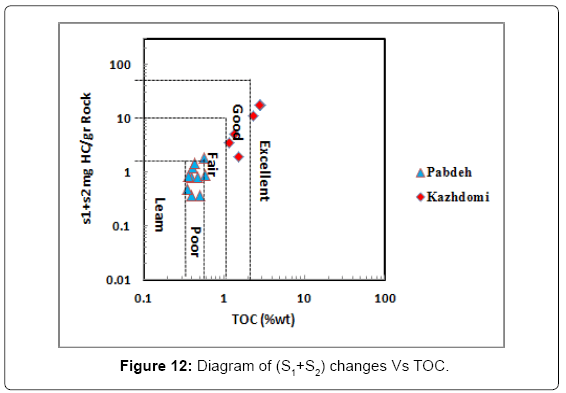
Figure 12: Diagram of (S1+S2) changes Vs TOC.
Conclusion
Study of organic geochemistry of Pabdeh and Kazhdomi formation in Bangestan anticline Using Rock-Eval 6 pyrolysis, identity’s hydrocarbon potential of source rock, Inert organic carbon, amount of hydrocarbon absorption in source rock, and also examining sedimentation condition and sedimentary environment of this formation, or capacity and potential of hydrocarbon generation in either of these formations. Regarding the acquired result, it became evident that samples of Kazhdomi formation in terms of hydrocarbon potential had better quality than Pabdeh formation. Type of available Kerogen in both of these formations for Kazhdomi formation mainly was Kerogen type II, and for Pabdeh formation in the range of continental and marine mixtures, the Kerogen type II and III. In addition, the value of inert organic carbon for Kazhdomi formation equal 1.0196 weight percent, and this value for Pabdeh formation equal 0.3957 weight percent. Also, both of formations own a hydrocarbon absorption rate by rock matrix, that for Kazhdomi formation this value equals 0.934, and for Pabdeh formation the value is 0.131. More absorption of Kazhdomi formation is because of more clay minerals contained in this formation. Changes of Sedimentary environment in these formations are various, and for Kazhdomi formation is in environmental ranges of AB, B, BC, CD, and C and for Pabdeh formation the environmental range is C, CD. Hydrocarbon generation potential of both of these formations is in a wide spread area of generating Oil and gas, but for Kazhdomi formation, a much more capacity of Oil-generating is expected due to its higher quality.
References
- Behar F, Beaumont V, DePenteado HL (2001) Rock-Eval 6 technology: Performances and developments. Oil & Gas Sci Technol Rev 56: 111-134.
- Espitalie J, Deroo G, Marquis F (1985) La pyrolysis Rock-Eval et ses applications. Rev Inst Franc du Pétr Part I 40: 563-578, Part II 40: 755-784, Part III 41: 73-89.
- Stoecklin J (1968a) Structural history and tectonics of Iran: a review. American Association of Petroleum Geologists Bulletin 52: 1229-1258.
- Agahanabati A (2005) Iran Geology. Geology and mine exploration organization.
- Moteei H (1998) Iran geology, strati graphology of Zagros. Geology and mine exploration Organization.
- Ala MA, Kinghorn RRF, Rahman M (1980) Organic geochemistry and source rock characteristics of the Zagros petroleum province, South West Iran. J Petrol Geol 3: 61-89.
- Tabatabaei H, Motamed A (2010) Geochemical Studies of Pabdeh Formation in Kupal Oil Field and Determination of Oil Production. The first international Applied Geological Congress, Islamic Azad University, Mashhad 2: 1528-1533.
- Peters KE (1986) Guidelines for evaluating petroleum source rock using programmed pyrolysis. American Association of Petroleum Geologists Bulletin 70: 318-329.
- Hunt JM (1996) Petroleum Geochemistry and Geology. (2ndedn.), WH Freeman, San Francisco, USA.
- Langford FF, Blanc-Valleron MM (1990) Interpreting Rock-Eval pyrolysis data using graphs of pyrolizable hydrocarbons vs. total organic carbon. AAPG Bull 74: 799-804.
- Bordenave ML, Burwood R (1990) Source rock distribution and maturation in the Zagros orogenic belt: provenance of the Asmari and Bangestan reservoir oil accumulations. Org Geochem 16: 369-387.
- Katz BJ, Elrod LW (1983) Organic geochemistry of DSDP site 467, offshore California, middle Miocene to lower Pliocene strata. Geochim Chosmochim Ac 47: 389-396.
- Katz BJ (1984) Source quality and richness of Deep Sea Drilling site 535 sediments, southeastern gulf of Mexico. Init Repts DSDP 77: 445-450.
- Dahl B, Bojesen-Koefoed J, Holm A, Justwan H, Rasmussen E, et al. (2004) A new approach to interpreting Rock-Eval S2 and TOC data for kerogen quality assessment. Org Geochem 35: 1461-1477.
- Justwan H, B Dahl (2004) Quantitive hydrocarbon potential mapping and organofacies study in the Greater Balder Area, Norwegian North Sea. Petroleum Geology Conference Series 6: 1317-1329.
- Jones RW (1987) Organic facies. Advances in Petroleum Geochemistry, Academic Press, New York, USA.
- Dean WE, Arthur MA, Claypool GE (1986) Depletion of 13C in Cretaceous marine organic matter: Source, digenetic, or environmental signal. Mar Geol 70: 119-157.
- Jackson KS, Hawkins PJ, Bennett AJR (1985) Regional facies and geochemical evolution of the southern Denison Trough. Australian Petroleum Exploration Association 20: 143-158.
Citation: Fakhri M, Tabatabaei H, Amiri A (2013) Comparing the Potential of Hydrocarbon Generation of Kazhdomi and Pabdeh Formations in Bangestan Anticline (Zagros Basin) According To Rock-Eval Pyrolysis Data. J Earth Sci Clim Change 4: 157. Doi: 10.4172/2157-7617.1000157
Copyright: ©2013 Fakhri M, et al. This is an open-access article distributed under the terms of the Creative Commons Attribution License, which permits unrestricted use, distribution, and reproduction in any medium, provided the original author and source are credited.
Share This Article
Open Access Journals
Article Tools
Article Usage
- Total views: 15814
- [From(publication date): 10-2013 - Apr 20, 2024]
- Breakdown by view type
- HTML page views: 11176
- PDF downloads: 4638