Assessment of Methane and Nitrous Oxide Emissions from Livestock in India
Received: 21-Jan-2011 / Accepted Date: 20-Jul-2011 / Published Date: 24-Jul-2011 DOI: 10.4172/2157-7617.1000107
Abstract
Methane emission contribution from Indian livestock is the highest (>70%) as compared to various other subsectors from agriculture sector viz. rice cultivation and open burning of crop residue. Methane emission factor (MEF) for ruminant livestock has been developed and is based on the country specific activity data. Methane emission from Indian livestock is estimated as 9.92 ± 2.37 Tg for the year 1994. Major emissions are from enteric fermentation (~90%) and are estimated to be around 8.97 ± 2.22 Tg, while from manure management is only around 0.95 ± 0.15 Tg. Nitrous oxide emissions from livestock is small and is estimated to be around 0.99 Gg in 1994. Methane emission was highest from cattle followed by buffalo and other species in livestock. Among the Indian states, Uttar Pradesh (UP) is the highest methane producer followed by Madhya Pradesh (MP), Bihar and Rajasthan due to their larger and denser livestock population. However the highest methane emission density per square kilometer is estimated for Punjab followed by West Bengal and Bihar. Methane emission from livestock had increased in last decades viz. from 9.0 Tg in 1981 to 9.9 Tg in 1992 mainly due to increase in animal population. It had stabilized thereafter mainly due to stabilization in animal population. India is deficient in livestock’s feed resources. Low milk productivity and high methane generation per kg milk in Indian livestock is due to animal’s feed having low quality roughage based diets with nutrient deficiency.
Keywords: Methane; Nitrous oxide; Enteric fermentation; Manure management; Dry matter intake
Introduction
Methane, an important greenhouse gas has the global warming potential, per molecule, of about 25 times than CO2 and has atmospheric residence time of about 8-11 years. Global atmospheric concentration of methane had increased at the rate of about 0.7% or 12 ppb year -1 during the decade proceeding 1994 [1] and has stabilized in recent years. Livestock, particularly the ruminants account for a significant portion of the global methane budget (about 65-100 million tons annually IPCC, 1997). India’s contribution in global emission of greenhouse gases (GHG) is about 2.7% due to anthropogenic activities [2]. The methane emission profile of India is agriculture dominant. Latest reports indicate that 45% of total country’s emission of methane is from livestock while nitrous oxide is negligible [3]. There are two sources of methane emission from livestock viz. enteric fermentation in rumen (for stomach) and manure management (animal wastes management practices).
About 200 species and strains of microorganisms are present in the digestive system of bovines and about 10 to 20 species, are believed to play an important role in ruminant digestion [4]. Methane is generated in the rumen (during normal digestive process) by methanogenic bacteria that utilize H2 to reduce CO2. Many factors contribute to ruminant methane production but two important mechanisms play significant role for methane production at variance. These are the magnitude and type of carbohydrates fermented and the production ratio of propionic acid to acetic acid. Livestock manure is primarily composed of organic material and water. Under anaerobic conditions, anaerobic and facultative bacteria decompose the organic matter of livestock waste. The end products are CH4, CO2 and stabilized organic material. Dung of animals contains sizable amount of nitrogen and its level depends upon the dietary intake of nitrogen and other nutrients. Animal fodders are reported to contain 10-40 g N/kg dry matter. The greater part of this N is organically bound, but as total nitrogen content increases so do the nitrate. Nitrous oxide is emitted from manure due to nitrification & de-nitrification of nitrogen contained in manure. The amount of N2O production depends on the quantity and composition of manure, manure management system and the duration of waste management.
Methodology
The emission coefficients required for emission estimates under Tier-II methodology of IPCC which is more detailed than tier-I are the methane conversion factor (MCF) and methane emission factor (MEF). For the key source category (cattle, buffalo, goat and sheep), tier II methodology is followed and for other livestock (Camel, Horses and Ponies, donkeys & Pig) tier I method of IPCC-96 is followed because these animals are not key source category of methane emission and without detailed activity data for these animals in Indian condition, Tier II methodology is difficult to adopt. A general guideline for arriving at MCF & MEF based on the general feed characteristics and animal production practices is recommended by IPCC. Therefore, the derivation of emission co-efficient, which reflects country specific animal management practices, is more appropriate under tropical conditions. The methodology for derivation of MEF requires data on feed intake/gross energy (GE values) of animal’s production level and activity data. Three methodological approaches for enteric fermentation were adopted to arrive at emission coefficients which are based on (i) dry matter intake, (ii) IPCC good practice guidance (energy balance equations) and (iii) feeding standards based on total digestible nutrients (TDN)/metabolisable energy (ME) which are used for the scientific assessment of inventory estimates of methane and nitrous oxide from livestock sector in India. The flow chart for estimation of methane emission from enteric fermentation is shown for the above methodological approach (Figure 1) and the activity data is discussed below.
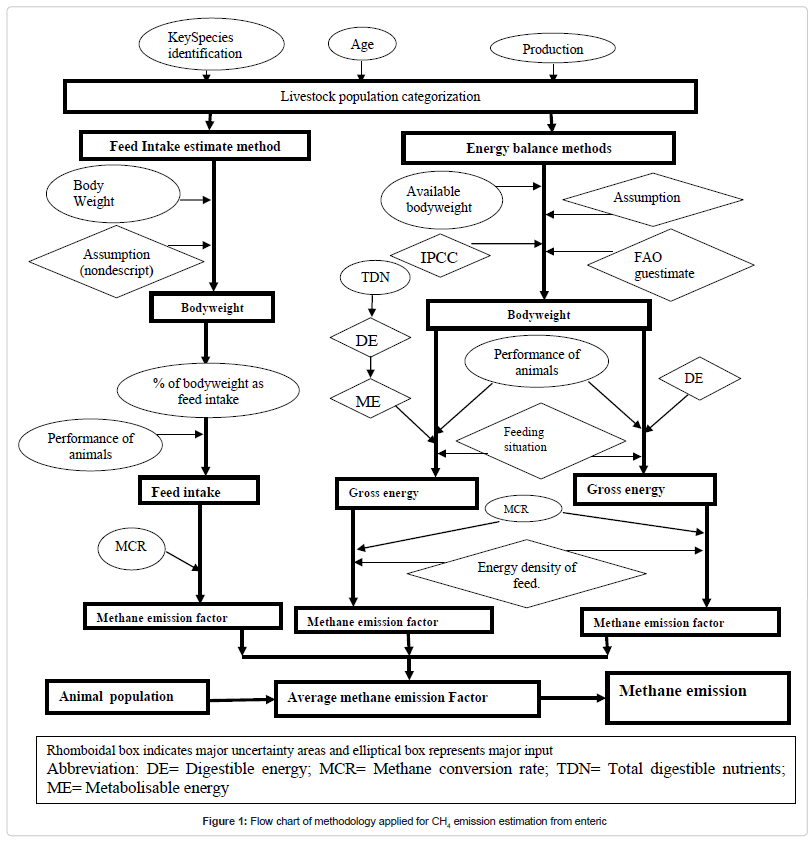
Figure 1: Flow chart of methodology applied for CH4 emission estimation from enteric
Livestock population
Latest detailed animal population data is available until the year 1992 and therefore the population figures for year 1994 are estimated by taking into account the growth rate [5] observed during the year 1977-1992 and the provisional figures of year 1997. It has taken into consideration of declining population in the indigenous cattle and working animals as observed in 1997 census (Figure 2). Cattle are categorized in crossbred and indigenous animals categories and further sub categorized to dairy and non-dairy cattle. Nondairy cattle are categorized on the basis of age viz. below one year, one to three year and adults, separately for indigenous and crossbred. In case of buffaloes, the categorization is same as cattle i.e. dairy and nondairy but brought under only one category without any sub-division into indigenous & crossbred as population data are not available for indigenous & cross bred separately. Sheep and goat are categorized into below 1 year and above one year. Data on slaughter rate, animal mortality and growth rates have been used as a measure of annual replacement rate to determine the percentage of animal population at 1 year and below. In sheep and goat, 50% emission of methane is taken from 3-6 months category (personal communication, Krishna). Camel, horses and ponies, donkeys and pigs are not subcategorized.
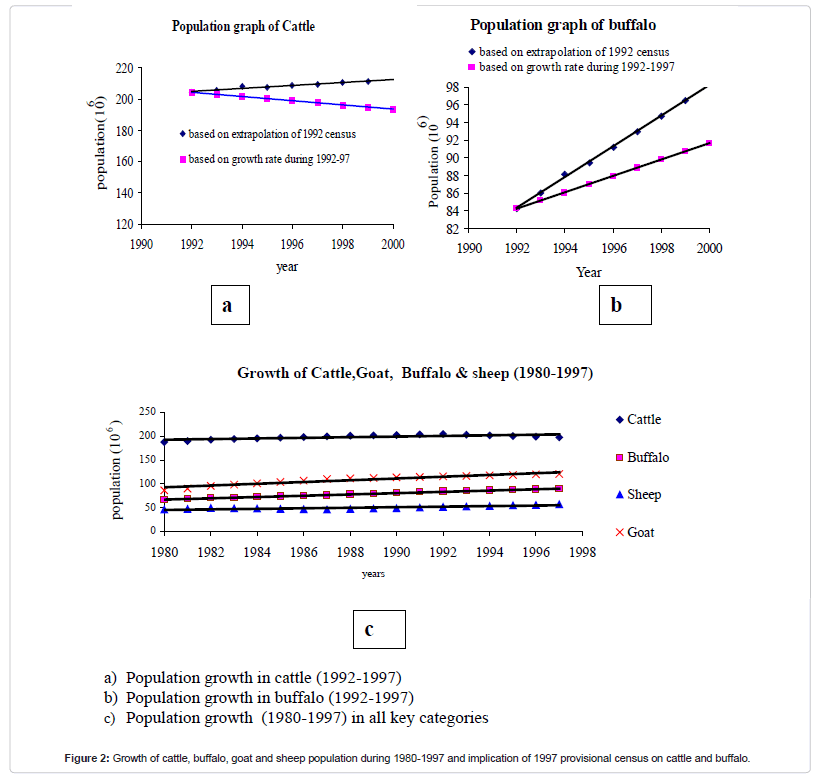
Figure 2: Growth of cattle, buffalo, goat and sheep population during 1980-1997 and implication of 1997 provisional census on cattle and buffalo.
Bodyweight
Information about body weight of 28 breeds of cattle and 8 breeds of buffalo is available [6]. However, majority of Indian cattle population (80%) is non-descript due to the reckless breeding system. The bodyweight of nondescript cattle is assumed bearing 20% less bodyweight than the well described bred in that particular region of the country on the basis of expert judgments. The reports on the body weight of Indian breeds of goats [7] and sheep [8] formed the basis for arriving at body weight in different Indian states. The bodyweight of other animals e.g. camel, mithun, yak, donkey, etc. were taken from literature to estimate the dry matter intake (DMI) in respective animals (Table 1). Another approach for body weight is the assumption based on previous inventory [9-11], Agricultural Research Data Book (2001) and IPCC guidelines [12] for cattle and buffalo (Table 2). The bodyweight of sheep and goat were taken from published reports [13,14]. The body weight obtained from first approach is used in the calculation of CH4 emission factor by dry matter intake methodology while the body weight obtained from second approach is used in the calculation based on energy equations for gross energy (GE) intake. The difference in bodyweight (20-30%) is due to variations in approaches adopted.
| Crossbred Male Body Wt. Crossbred female Body Wt. |
|---|
| Calves < 1 year age (70%) 70-88.5 Calves <1 year age (70%) 75-88 |
| Calves 1-3 years age 154-195 Calves <1-3 years age 165-194 |
| Breeding bulls 280-354 Milking cows 300-352 |
| Working bulls 280-354 Dry cows 300-352 |
| Breeding + working bulls 280-544 Heifers 165-194 |
| Others 266-336 Others 200-330 |
| Indigenous Cattle Male Indigenous Cattle Female |
| Calves |
| Calves 1-3 years age 136-157 Calves < 1-3 years age 136-157 |
| Breeding bulls 260-320 Milking cows 200-333 |
| Working bulls 260-320 Dry cows 200-363 |
| Breeding + working bulls 260-320 Heifers 200-250 |
| Others 247-285 Others 200-330 |
| Buffaloes Male Buffaloes female |
| Calves < 1 year age (70%) 70-80 Calves < 1 year age (70%) 80-100 |
| Calves 1-3 years age 160-200 Calves < 1-3 years age 176-220 |
| Breeding bulls 475-550 Milking buffaloes 400-516 |
| Working bulls 475-550 Dry buffaloes 400-516 |
| Breeding + working bulls 475-550 Heifers 276-320 |
| Others 450-500 Others 275-416 |
| Goats Male Goats Female |
| <1 year age ((70%) 8.8-21.7 <1 year age (70%) 8.8-21.7 |
| 1-2 years age 12-27 1-2 year age 12-25.6 |
| Sheep Male Sheep Female |
| <1 year age ((70%) 14-22 <1 year age (70%) 14-22 |
| 1-2 years age 30-40 1-2 year age 25-30 |
| Camel 300 |
| Pigs 70 |
| Horses & Ponies |
| Male |
| >3 years 300 |
| Donkey 150 |
| Mithun 400 |
| Yak 230-300 |
| Mule 150 |
Table 1: Categories of livestock and their bodyweight (kg) for dry matter intake method.
| Parameter | Cattle | Buffalo | ||||||||||
|---|---|---|---|---|---|---|---|---|---|---|---|---|
| Indigenous | Crossbred | |||||||||||
| Young | Adults | Young | Adults | Young | Adults | |||||||
| Below 1year | 1 to 3 Year |
Dairy | Nondairy | Below 1year | 1 to 3 year |
Dairy | Nondairy | Below 1year |
1 to 3 year |
Dairy | Nondairy | |
| Weight (Kg) | 40 | 140 | 175 | 200/ 175 | 60 | 180 | 275 | 300/ 275 | 70 | 180 | 275 | 300/ 275 |
| Weight gains (kg day-1) |
0.11 | 0.18 | 0 | 0 | 0.19 | 0.27 | 0 | 0 | 0.23 | 0.25 | 0 | 0 |
| Milk (kg day-1) | 0 | 0 | 1.7 | 0 | 0 | 0 | 5.73 | 0 | 0 | 0 | 3.6 | 0 |
| Fat content of milk (%) | 4.7 | 4.1 | 7.4 | |||||||||
| Work hours per day | 0 | 0 | 0 | 1.7 | 0 | 0 | 0 | 0 | 0 | 0 | 0 | 1.7 |
| Pregnancy (%) | 0 | 0 | 40-50 | 0 | 0 | 0 | 50 | 0 | 0 | 0 | 35 | 0 |
| Digestibility of feed (%) | 50-60 | 50-60 | 50-60 | 50-60 | 55-65 | 55-65 | 55-60 | 55-65 | 50-60 | 50-60 | 50-60 | 50-60 |
Table 2: Consolidated activity data for deriving Methane Emission Factors for cattle and buffalo using energy balance equation.
Feeding situation
Feeding practices in India are not well documented. In India 95% of cattle are held in small animal holdings and only 5% of the total cattle are managed by organized farmhouses [9]. Traditionally the cattle and buffaloes are fed on dry crop residues (wheat straw, paddy straw, stovers, etc.) mixed with green grasses and cultivated seasonally available forages. Most of the dry and non-producing animals are allowed to graze during the day on roadsides/wastelands grass, community grazing grounds, tree leaves or grasses. In the evening they are fed straw in corrals or stalls. A survey conducted in India [15] showed the following ranges (percentages) of feed components in rations varying according to agro-climatic region, season and stage of the production cycle: grass and grazing 15-30%, crop residues 66-70%, cultivated for ages 5-8% and concentrates 2-5%. Sheep and goat mainly managed on grazing and pigs on scavenging. Total dry matter availability for 1994 is about 474 million tons from crop residues, green forages and concentrates on dry weight basis. Further there is a shortage of feed and fodder by 10-15% [16]. The gap between supply and demand of dry matter and total digestible nutrients (TDN-31%) and crude protein (CP-58%) in India is mainly due to the low availability of good quality feed for most of the bovine population. All crossbred animals are considered as stall fed and other are considered as 50% stall-fed and 50% range land fed, on average.
Dry matter/ Gross energy intake
Feed intake is positively related to animal size, feeding situation, growth rate and production (e.g. milk production, work hours per day, wool growth or pregnancy; IPCC-1995). Feed intake is estimated based on dry matter intake (DMI) as percentage of body weight as well as GE intake required by animals for maintenance and production. Data on digestibility of different feeds in various categories of animals published by animal nutritionists working in different laboratories in almost each state [17,18] were collected from various reports.
The feed intakes in terms of dry matter intake for various subcategories were calculated based on percentage of bodyweight (kg DMI 100kg-1 bodyweight). The DMI requirement were calculated based on information collected from various reports are 1.8 – 2.5 kg DMI/ 100 kg body weight (Indigenous Cattle), 2.0 – 3.0 kg DMI/ 100 kg body weight (Crossbred Cattle), 1.8 – 2.8 kg DMI/ 100 kg body weight (Buffalo) and 3.0 – 4.0 kg DMI/ 100 kg body weight (Sheep & Goat) [19].
GE is estimated in terms of MJ day-1 by two methods. First method is by using appropriate TDN requirement from tables of feeding standard [20], which varies according to age, species, Production level and performance (Lactation, work, breeding, growth). TDN values have been converted to digestible energy (DE) and then to GE (MJ) values using appropriate equations/conversion factors in conformity with the IPCC good practice guidance, as the data are country specific. Another method is by using IPCC energy equations [12]. Activity data are used for the energy balance equation. The estimated gross energy (MJ day-1) for each subcategory (for cattle and buffalo) is converted into DMI using energy density data (18.45 MJ/kg dry matter) of IPCC- 1996. Average bodyweight (representative bodyweight) of the animals for different subcategories are used for calculation as the body weight of animals generally fluctuate during different seasons.
Methane conversion rate (MCR)
MCR depends on several interacting feed and animal characters including genetic factors. Feeding experiments conducted in Indian laboratories has been reviewed for MCR (g methane kg-1 DMI) and the average MCR of the reported values [19] has been taken for calculation (Table 3). These MCR values were converted in terms of percentage of gross energy using appropriate conversion factors. The recorded MCR values (4.8-6% of GE intake in cattle and 4.8-5.4% in adult buffalo and 3-4% in buffalo calves) obtained in these studies are significant, as they are less than the values recommended by IPCC for Indian subcontinent. Since these values are based on local Indian feed and animal characteristics, it is believed that these values reflect the true characteristics of feed consumption and their utilization by cattle and buffalo under Indian condition.
| Category | Sub category | Methane emission (g CH4 /kgDMI) |
Corresponding MCR as % of GE |
|---|---|---|---|
| Crossbred | All Category | 16 | 4.8 |
| Indigenous male | 0-1 yr | 17 | 5.0 |
| 1-3 yrs | 20 | 5.4 | |
| Breeding | 20 | 6.0 | |
| Working | 20 | 6.0 | |
| Breed+Wor k | 20 | 6.0 | |
| Nothing | 16 | 4.8 | |
| Indigenous Female | All Category | 16 | 4.8 |
| Buffalo | 0-1 yr | 10 | 3.0 |
| 1-3 yrs | 13 | 3.9 | |
| Adults (Dairy+Nondairy) | 18 | 5.4 |
Table 3: Methane conversion rate taken for the estimation of methane from Indian Bovine.
Methane emission factors (kg methane head-1 year-1)
The average values of three emission factors derived from three approaches are taken as final for the estimation of methane generation from the enteric fermentation of key source category i.e. ruminants. Comparison of emission factors of IPCC and new emission factors are given in Table 4. Methane emission from enteric fermentation is obtained by multiplying EFs to livestock population. In case of other animals like camel, horses and ponies, donkeys, and pig, default emission factors are used to obtain methane emission from these categories.
| Category | Enteric fermentation | Manure management | |||
|---|---|---|---|---|---|
| IPCC | NATCOM | IPCC | NATCOM | ||
| Dairy cattle | Indigenous | 46 | 28 ± 5 | 5.0 | 3.5 ± 0.2 |
| Crossbred | 46 | 43 ± 5 | 5.0 | 3.8 ± 0.8 | |
| Non dairy cattle (indigenous) |
0-1 year | 17 | 9 ± 3 | 2.0 | 1.2 |
| 1-3 year | 25 | 23 ± 8 | 2.0 | 2.8 | |
| Adult | 25 | 32 ± 6 | 2.0 | 2.9 ± 1.4 | |
|
Non-dairy cattle |
0-1 year | 17 | 11 ± 3 | 2.0 | 1.1 |
| 1-2 ½ year | 25 | 26 ± 5 | 2.0 | 2.3 | |
| Adult | 25 | 33 ± 4 | 2.0 | 2.5 ± 0.9 | |
| Dairy buffalo | 55 | 50 ± 17 | 5.0 | 4.4 ± 0.6 | |
| Non dairy Buffalo |
0-1 year | 23 | 8 ± 3 | 5.0 | 1.8 |
| 1-3 year | 55 | 22 ± 6 | 5.0 | 3.4 | |
| Adult | 55 | 44 ± 11 | 5.0 | 4.0 | |
| Sheep | 5 | 4 ± 1 | 0.3 | 0.3 | |
| Goat | 5 | 4 ± 1 | 0.2 | ||
| Horses & Ponies | 18 | IPCC Default | 1.6 0.9 1.6 4.0 |
IPCC Default | |
| Donkeys | 10 | ||||
| Camels | 46 | ||||
| Pigs | 1 | ||||
Table 4: Comparison of Methane Emission factors for enteric fermentation (IPCC source Table 4-3, A-2 & A-3 of IPCC 1996.
Estimation of methane and nitrous oxide from manure management
The flow chart for estimation of methane emission from manure management is shown for the methodological approach adopted (Figure 3). The disposal rate of dung varies from state to state and depends on climate and the availability of firewood. Due to absence of sufficient state-wise data on fraction of manure managed in wet and dry manure management systems as stipulated in IPCC guidelines, the recommended values on the fraction of manure managed in different manure management systems were used for the present estimation (Table B-3 & B-5, IPCC, 1996).
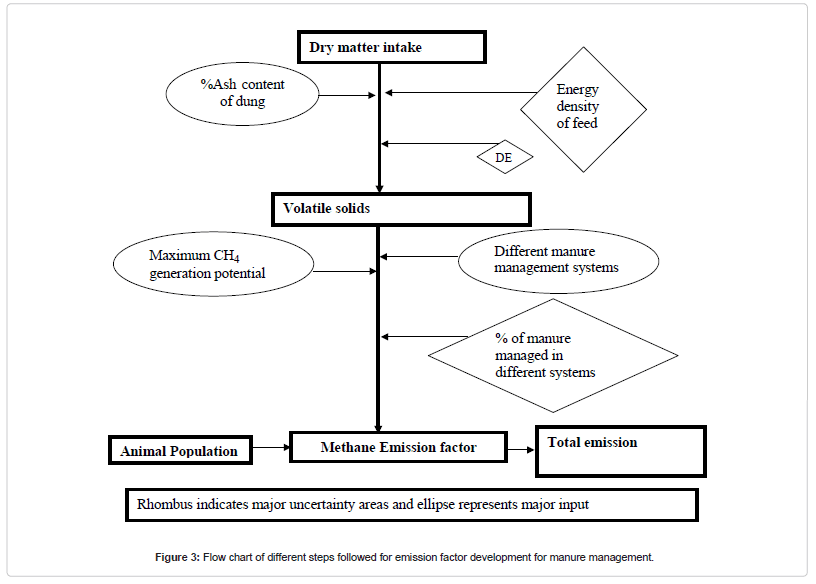
Figure 3: Flow chart of different steps followed for emission factor development for manure management.
Animal population data of states have been grouped into cool, temperate and warm regions based on meteorological data from 391 meteorological stations (IMD). Volatile solids (VS) were calculated taking ash content of Indian manure as 17% (Gaur, 2002) and maximum methane producing potential of manure (Bo) from IPCC 1996 for cattle and buffalo. For other livestock, default emission factors of IPCC, 1996 are used. Emission factors were separately calculated for warm, temperate and cool regions of the country and finally arrived at a common emission factor for the country in each subcategory by weighted average (Table 4). Comparative calculations were also made using data available for the country following the steps described in IPCC [12]. The values obtained broadly agree with the emission estimates.
IPCC default values for nitrous oxide emissions from manure management practices are used in the present estimation. As per the guidelines manure of cattle, pig and poultry only account for the N2O emissions and manure of other animals like sheep, goat, camel, etc. are generally not managed, are eliminated from the category of animal producing N2O from animals waste management system (AWMS). Total emission is determined by multiplying the number of animals in each category with emission factor.
Results and Discussions
Emission factors of subcategories of cattle and buffalo vary from IPCC default values, because of the fact that emission factors given in IPCC guidelines are based on the calculations using higher bodyweight and other performance data of animals [12]. Indian livestock mainly thrive on wheat straw, paddy straw, stovers and other agro-industrial wastes which has higher ash content and lower volatile solids (VS) than the conventional good quality foodstuffs used in developed countries. Variation in the emission factor for manure management is due to consideration of ash content of dung as 17% rather than 8% as given in IPCC [12].
Methane emission factors from India have been revised time to time. Methane emission factor (22.6 and 32 kg head-1 year-1, for indigenous and crossbred cattle & 25.7 and 40 kg head-1year-1,for indigenous and buffer bred buffalo) developed based on energy equations [21], was used for methane emission estimate [9]. The emission factors were revised considering energy requirement during pregnancy, energy requirement during grazing, etc. and adopting IPCC guidelines, 1995 [22]. Based on in vitro and in vivo dry matter digestibility experiments conducted at NDRI, Karnal, Singh and Mohini [23], reported emission factors for different categories of bovines. Singh [24], further revised the emission factors as 72.74 g CH4/ day in cattle, 97.01 g CH4/ day in buffalo, 11.63 g CH4/ day in sheep and 10.14 g CH4/ day in goat after incorporation of some more varieties of feed and fodder in experimentation. These emission factors resulted in various emission estimates, which range from about 6.91 and 7.26 Tg for the year 1990 and 1995 [2], about 9 Tg for the year 1992 [23-25] to about 10.58 Tg for the year 2000 [26]. Now these emission factors are revised considering wide variation in animal management practices, feeding practices as well as productivity of bovine and ovine in India. The contribution of methane emission from Indian livestock is estimated in present work as 8.97± 2.22 Tg from enteric fermentation and 0.95± 0.15 Tg from manure management with a total of 9.92±2.37 Tg yr-1 for the calendar year 1994 (Table 5). The enteric fermentation and manure management ratio for methane emission is about 9 and is maintained in all states with marginal variations. Methane contribution by indigenous cattle, crossbred cattle and buffalo is 53.81%, 4.87% and 33.43% followed by small ruminants (sheep-2.09% and goat-4.44%) and a small percentage (1.36%) from remaining animals. Non-dairy cattle are the highest emitters (39.69%) followed by dairy buffalo (22.58%) & the dairy cattle (18.99%). Indian states of Andhra Pradesh, Bihar, Madhya Pradesh, Maharashtra, Rajasthan, and Uttar Pradesh are responsible for about 5.8 Tg of methane emission from livestock sector in India. The methane emission density (tons km-2) for livestock varies from state to state. There is wide variation from Punjab (6.7) followed by West Bengal (6.6), Bihar, Haryana and UP (5.5), to 0.1 in Arunachal Pradesh/ Mizoram, with the all India average being 3.0 tons km-2. Methane emission from cattle varies from 9.0 to 9.9 Tg yr-1 during the period 1981 to 1992 and thereafter stabilized at the same level (Table 6). Increase in methane emission during this period is due to substantial increase of overall livestock population by 14.70% with an annual increase of 1.23%. Furthermore, there has been a steady increase of bovine population by 12.14% during this period with an annual increase of 1.01% till 1992. However, the trend has reversed after 1992 resulting in decline of bovine population by 0.79% during 1992-97 with an annual decrease of 0.16 %. However small ruminant population has increased substantially.
| Country | Population (000) |
EF Enteric Fermentation |
EF Manure management |
Emission (Gg/yr) Enteric Fermentation |
Emission (Gg/yr) Manure management | Total Emission (Gg/yr) | |
|---|---|---|---|---|---|---|---|
| Category | Sub category |
||||||
| Dairy cattle | Indigenous | 51304 | 28 ± 5 | 3.5 ± 0.2 | 1436.51 ± 256.52 | 179.56 ± 10.26 | 1616.08 ± 266.78 |
| Crossbred | 5715 | 43 ± 5 | 3.8 ± 0.8 | 245.75 ± 28.58 | 21.72 ± 4.57 | 267.46 ± 33.15 | |
| Non dairy cattle (indigenous) | 0-1 year | 25411 | 9 ± 3 | 1.2 | 160.09 ± 53.36 | 21.35 | 181.43 ± 53.36 |
| 1-3 year | 33424 | 23 ± 8 | 2.8 | 768.75 ± 267.39 | 93.59 | 862.34 ± 267.39 | |
| Adult | 76690 | 32 ± 6 | 2.9 ± 1.4 | 2454.08 ± 460.14 | 222.40 ± 107.37 | 2676.48 ± 567.51 | |
| Non-dairy cattle (Crossbred) |
0-1 year | 3271 | 11 ± 3 | 1.1 | 25.19 ± 6.87 | 2.52 | 27.71 ± 6.87 |
| 1-2 ½ year | 2748 | 25 ± 5 | 2.3 | 68.70 ± 13.74 | 6.32 | 75.02 ± 13.74 | |
| Adult | 3280 | 32 ± 5 | 2.5 ± 0.9 | 104.96 ± 16.40 | 8.20 ± 2.95 | 113.16 ± 19.35 | |
| Dairy buffalo | 41162 | 50 ± 17 | 4.4 ± 0.6 | 2058.10 ± 699.75 | 181.11 ± 24.70 | 2239.21 ± 724.45 | |
| Non dairy buffalo | 0-1 year | 17935 | 8 ± 3 | 1.8 | 100.44 ± 37.66 | 22.60 | 123.03 ± 37.66 |
| 1-3 year | 1509 | 22 ± 6 | 3.4 | 331.98 ± 90.54 | 51.31 | 383.29 ± 90.54 | |
| Adult | 11872 | 44 ± 11 | 4.0 ± 0.01 | 522.37 ± 130.59 | 47.49 ± 0.24 | 569.86 ± 130.83 | |
| Sheep | 53180 | 4 ± 1 | 0.3 | 193.63 ± 48.41 | 13.55 | 207.19 ± 48.41 | |
| Goat | 117469 | 4 ± 1 | 0.2 | 422.51 ± 105.63 | 17.96 | 440.46 ± 105.63 | |
| Horses & Ponies | 725 | 18 | 1.6 | 13.05 | 1.19 | 14.24 | |
| Donkeys | 835 | 10 | 0.9 | 8.35 | 0.75 | 9.10 | |
| Camels | 971 | 46 | 1.6 | 44.67 | 1.59 | 46.26 | |
| Pigs | 13105 | 1 | 4 | 13.11 | 52.42 | 65.53 | |
| Total CH4 (Tg) | 8.97 ± 2.22 | 0.95 ± 0.15 | 9.92 ± 2.37 | ||||
Table 5: Population of different livestock categories, CH4 Emission Factors and total methane emission from whole country (1994).
| Years | IPCC | NATCOM | ALGAS |
|---|---|---|---|
| 1980 | 10.5 | 8.9 ± 2.1 | 6.7 |
| 1981 | 10.7 | 9.0 ± 2.1 | 6.9 |
| 1982 | 10.6 | 9.0 ± 2.1 | 6.9 |
| 1983 | 10.7 | 9.1 ± 2.1 | 6.9 |
| 1984 | 10.9 | 9.3 ± 2.2 | 7.0 |
| 1985 | 11.0 | 9.3 ± 2.2 | 7.1 |
| 1986 | 11.1 | 9.4 ± 2.2 | 7.1 |
| 1987 | 11.1 | 9.4 ± 2.2 | 7.2 |
| 1988 | 11.3 | 9.5 ± 2.3 | 7.3 |
| 1989 | 11.4 | 9.6 ± 2.3 | 7.3 |
| 1990 | 11.5 | 9.7 ± 2.3 | 7.4 |
| 1991 | 11.6 | 9.8 ± 2.3 | 7.5 |
| 1992 | 11.8 | 9.9 ± 2.4 | 7.6 |
| 1993 | 11.8 | 9.9 ± 2.4 | 7.6 |
| 1994 | 11.8 | 9.9 ± 2.4 | 7.6 |
| 1995 | 11.8 | 9.9 ± 2.4 | 7.6 |
| 1996 | 11.8 | 9.9 ± 2.4 | 7.6 |
| 1997 | 11.8 | 9.9 ± 2.4 | 7.6 |
| 1998 | 11.9 | 9.9 ± 2.4 | 7.6 |
| 1999 | 11.9 | 9.9 ± 2.4 | 7.6 |
| 2000 | 11.9 | 9.9 ± 2.4 | 7.6 |
Table 6: Methane emission (Tg) from livestock (both enteric fermentation and manure management) during 1980-2000.
After observing correlation between body weight, milk production and methane emission (Figure 4), it was found that a linear regression usually gives a good fit to the body weight V. methane emission of cattle and buffalo (Figure 4a), and milk production V. methane emission in dairy buffalo (Figure 4c). But in case of crossbred and indigenous dairy cattle polynomial regression usually gives a good fit to the milk production V. methane emission data (Figures 4b and 4d respectively). Hence we may infer that bodyweight and milk production are dominant factors in determining the quantity of methane produced. The contribution of nitrous oxide emission from Indian livestock is estimated to be 0.9992 Gg from manure management for the year 1994, which is given in Table 7 along with the state values. The ratio of global warming potential of GHG emissions of methane and nitrous oxide from livestock sector calculated in terms of CO2 equivalent is about 99.9 to 0.1 respectively. The state wise methane emission estimate comparison using 1994 livestock population data and the emission factors arrived in this work & default IPCC-96 is given in Table 8. It is observed that the IPCC default values gave higher estimates as compared to EF derived in present work.
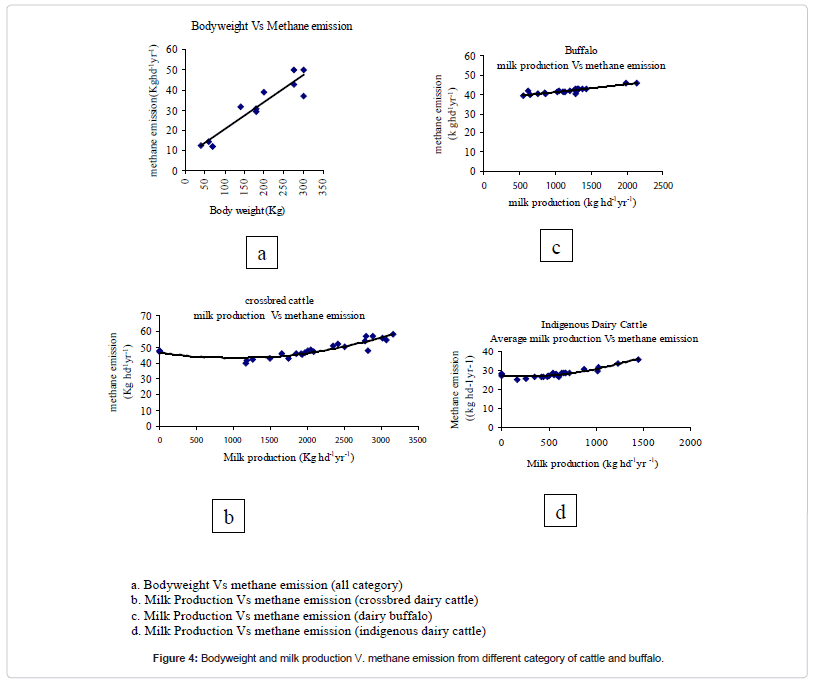
Figure 4: Bodyweight and milk production V. methane emission from different category of cattle and buffalo.
| States | Emission (Gg/Yr) |
|---|---|
| Andhra Pradesh | 0.1469 |
| ArunachalPradesh | 0.0050 |
| Assam | 0.0620 |
| Bihar | 0.0643 |
| Goa | 0.0027 |
| Gujarat | 0.0182 |
| Haryana | 0.0306 |
| Himachal Pradesh | 0.0028 |
| Jammu & Kashmir | 0.0140 |
| Karnataka | 0.0497 |
| Kerala | 0.0619 |
| MadhyaPradesh | 0.0508 |
| Maharashtra | 0.0998 |
| Manipur | 0.0116 |
| Meghalaya | 0.0073 |
| Mizoram | 0.0039 |
| Nagaland | 0.0111 |
| Orissa | 0.0438 |
| Punjab | 0.0514 |
| Rajasthan | 0.0155 |
| Sikkim | 0.0012 |
| Tamil Nadu | 0.0739 |
| Tripura | 0.0092 |
| Uttar Pradesh | 0.0620 |
| West Bengal | 0.0962 |
| Union Territories | 0.0035 |
| India ( N2O Gg/Yr) | 0.9992 |
Table 7: State wise consolidated data of Nitrous Oxide emission.
 |
Enteric fermentation | Manure management | ||
|---|---|---|---|---|
| IPCC | NATCOM | IPCC | NATCOM | |
| AP | 787.18 | 661.69 ± 174.40 | 76.71 | 67.66 ± 11.45 |
| Arunachal | 10.19 | 9.32 ± 1.93 | 1.87 | 1.89 ± 0.21 |
| Assam | 347.29 | 297.44 ± 66.95 | 37.74 | 36.34 ± 5.94 |
| Bihar | 986.35 | 856.92 ± 209.07 | 91.54 | 89.79 ± 15.98 |
| Goa | 5.10 | 4.28 ± 1.04 | 0.84 | 0.79 ± 0.07 |
| Gujrat | 486.43 | 398.94 ± 105.82 | 45.99 | 39.97 ± 6.48 |
| Haryana | 281.15 | 216.90 ± 60.45 | 29.40 | 23.68 ± 2.32 |
| Himachal | 108.74 | 93.83 ± 22.52 | 9.94 | 9.13 ± 1.73 |
| J&K | 147.84 | 126.38 ± 28.88 | 13.22 | 12.09 ±1.91 |
| Karnataka | 642.25 | 544.81 ± 132.95 | 60.37 | 55.82 ± 9.97 |
| Kerala | 131.75 | 107.51 ± 21.13 | 13.45 | 11.08 ± 1.27 |
| MP | 1265.43 | 1048.45 ± 254.53 | 122.54 | 112 ± 19 |
| Maharastra | 835.66 | 717.20 ± 170.22 | 78.90 | 72 ± 14 |
| Manipur | 26.22 | 24.04 ± 5.23 | 3.96 | 4 ± 1 |
| Meghalaya | 20.38 | 17.15 ± 3.98 | 3.07 | 3 ± 0 |
| Mizoram | 2.24 | 1.82 ± 0.39 | 0.66 | 1 ± 0 |
| Nagaland | 12.04 | 10.72 ± 2.10 | 3.22 | 3 ± 0 |
| Orissa | 506.96 | 436.39 ± 98.02 | 48.92 | 47 ± 9 |
| Punjab | 381.22 | 305.26 ± 85.25 | 38.01 | 30 ± 4 |
| Rajasthan | 868.67 | 680.31 ± 171.24 | 78.85 | 66 ± 8 |
| Sikkim | 6.22 | 5.57 ± 1.16 | 0.73 | 1 ± 0 |
| TamilNadu | 460.37 | 389.22 ± 91.18 | 44.85 | 40 ± 6 |
| Tripura | 30.07 | 25.70 ± 5.57 | 3.54 | 3 ± 0 |
| UttarPradesh | 1757.46 | 1443.39 ± 377.50 | 178.50 | 156 ± 23 |
| WestBengal | 623.36 | 531.20 ± 119.19 | 59.22 | 57 ± 9 |
| Union Territories | 22.10 | 17.78 ± 4.90 | 2.36 | 2 ± 0 |
| India (CH4 Tg/yr) | 10.75 | 8.97 ± 2.22 | 1.05 | 0.95 ± 0.15 |
Table 8: State wise methane emission (Gg/yr) from Enteric Fermentation and manure management and comparison with estimates using IPCC emission factors.
State wise consolidated data of Nitrous Oxide emission.
India is the largest producer of milk in the world due to large bovine population, however methane emission per head is lower (Figure 5). Ratio of methane emission in a dairy cattle with its milk production is large, mainly due to low quality feed and genetic factor. The country average methane production per kg of milk is 72± 11g kg-1 milk for cattle and in this the indigenous dairy cattle (96 ± 16) has higher values compared to cross-bred dairy cattle (28 ± 4) whereas for buffalo it is about 66 21 g kg-1 milk. There existed a wide regional variation among the states and ranges from 26 g kg-1 milk in Punjab to 270 gm kg-1 milk in Orissa, in case of dairy cattle. In case of buffaloes, the state of Orissa shows highest emission of about 191 62 g CH4 kg-1 milk and the lowest being in Haryana (35±11 g CH4 kg–1 milk). Highest milk producing states recorded the lowest methane per kg of milk produced or in other words the lesser methane emission per kg milk indicated better nutritional status of livestock.
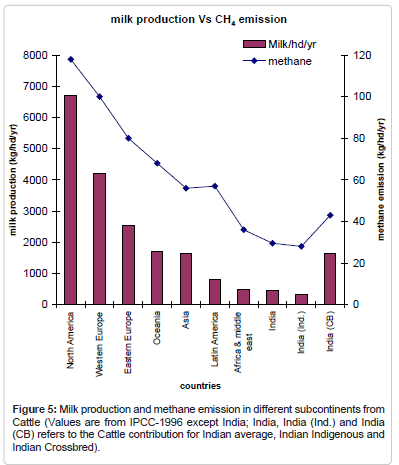
Figure 5: Milk production and methane emission in different subcontinents from Cattle (Values are from IPCC-1996 except India; India, India (Ind.) and India (CB) refers to the Cattle contribution for Indian average, Indian Indigenous and Indian Crossbred).
Uncertainty in CH4 estimation
Uncertainty in livestock population data depends on the extent and reliability of national census & survey methods. There may be different accounting conventions for animals that do not live for whole year e.g. in case of sheep and goat where slaughtering is done. For the cattle and buffalo, who are below one year of age and consist around 30 % of its population below three months of age, is not taken into consideration for the purpose of methane estimation as this fraction is fed on milk thereby having no fermentation and hence no methane generation in their rumen. Though uncertainties have largely been taken care in the activity data, they do exist to certain extent in defining feeding situation, digestibility and body weights of cattle and buffalo. Some variations may occur in body weights and DE depending upon the type of feed availability, the nature of the animal (genetic and ecology factors) and the region to which they belong. The variations may occur around ± 5% in DE and ± 10% in body weights. An uncertainty of about ± 24 % may exist in methane emission estimates depending on the variations at different stages of calculation.
Quality assurance and quality control (QA/QC)
The quality of much of the input data depends on the procedures of the organizations providing the data (e.g. Agricultural Statistics, Indian Livestock Census). Documentation of their QA/QC procedures was not readily available. Agricultural Statistics for example have a range of QA/QC procedures associated with survey design, data input and consistency checks on the survey results and the aggregated values. For this inventory, particular attention was paid to the checks on the conversion values and for compatibility between the units used. Quality control checks were made across the inventory worksheets for the entire sub sector. These checks addressed input data values, formulae, and summation procedures. A round robin test for the known standard of methane, for inter comparison was conducted between organizations to assure the quality in the gas chromatographic measurements. SF6, CH4 and N2O gas standards traceable to national & international NMIs (National Metrological Institutes) were supplied to National Dairy Research Institute (NDRI), Karnal to ensure the confidence level of the results of in vivo feeding trials for the estimation of methane emission, by tracer technique, from animals.
Feeding practices in India is not well surveyed and only few workers have surveyed some regions. Therefore the expert judgment on feeding situation was taken for calculation purpose to make the inventory more reliable. Since all the data required for inventory calculation e.g. population, milk production, etc. are secondary in nature, they were cross-checked with different sources. Average annual body weights of animals are taken for calculation, thus criteria for enhanced categorization is fulfilled. Required weightage have been given to the percentage of population underlying different subcategories during the calculation of gross energy intake and methane emission factor.
Mitigation options
In the agricultural sector the most promising area for reducing methane emission is from livestock and more particularly bovines because major part of methane emissions from agriculture sector is coming from livestock particularly bovines and more than 45% of emissions in India are coming from this sector. There has been a growing awareness among the researchers in India for improved nutrition of large ruminants fed on crop residues, agro-industrial by-products or tropical pastures and for implementing/ proposing feeding strategies for eco-friendly animal production in India, which also reduces methane production and add to national economy [24,25,27-29]. The mitigation options, as below, for methane emission in the Indian context from livestock sector need to be cost effective, and should also address religious and socio-economic problems. The possible options for mitigation of methane emission from livestock in India are discussed below:
Increase of feed conversion efficiency
It is possible to reduce energy losses due to methanogenesis and to improve animal efficiency by some options like improving the energy density of animals ration (using non-edible oils and by other fat sources), providing the balanced feeds (using the improved feed processing technologies), modification in feeding (like alkali/ ammonia treatment of low digestibility straws), using the feed additives (such as ionophores and herbal products which enhance the propionate production), and supplementation with molasses/ urea nutrient blocks (UNB) (to overcome nutrient deficiency).
Feeding ruminants on diets containing high levels of readily fermented non-structural carbohydrate has been shown to minimize methane production by reducing the protozoal population and lowering rumen pH [30]. However, this can give rise to an overall depressed ruminal fermentation, which may lower the conversion of feed energy into animal product and may be detrimental to the animal’s health. Increasing the level of modified feed intake changes in such a way that without depressing ruminal fermentation, less acetate and more propionate are formed from rumen volatile fatty acid (VFA), which would not only result in productivity of the animals but also the reduction of methane.
Increase of animal’s productivity
Supplementing production-enhancing agents to animal feeds can improve animal productivity in terms of growth and milk. Many antibiotics, ionophores and halogenated compounds are known for production stimulation and some of them have a direct effect on methanogenesis in the rumen. Ionophores are chemical feed additives, which increase productivity by adjusting several fermentation pathways. Their use in dairy cow needs careful attention because a withdrawal period is required before human consumption of dairy products. However it can reduce methane production from rumen up to 25% [31]. Animal production can also be improved through transgenic manipulation or biotechnology reproduction techniques. This technique may be used to modify the fermentation characteristics of rumen microorganisms [32]. It involves enhanced cellulolytic activity in the rumen biomass for forage fed animals to increase their supply of VFAs and amino acids, and a reduction in methanogenesis accompanied by an alternative hydrogen sink through increasing propionate production. It involves genetically engineered bacteria.
Livestock reduction
In the Indian context it is a difficult option due to religious and socio-economic conditions as the majority of the farmers are dependent on livestock for agricultural work besides religious sentiments attached to cattle. Nevertheless, the introduction of improved breeds with higher productivity/ efficiency can bring about a gradual change.
Manure management
Better manure management and methane recovery techniques may consist of options like using biogas plants for manure in which the recovered methane can be used for energy generation. Around 2.6 million biogas plants had been installed up to the end of year 1997 in rural India [33], which is a good effort of energy conservation as well as methane emission reduction from livestock waste. If livestock manure is kept under aerobic conditions viz. by turning the manure regularly or by forced, methane emission from manure management can be reduced.
Conclusions
Indian bovines emit lesser amount of methane on per head basis as compared to their western counterparts due to lower size, bodyweight and productivity. Emission factor developed for Indian livestock vary significantly from IPCC recommended value due to the same reason. Total methane emission from Indian livestock (cattle, buffalo, sheep, goat, horses and ponies, camel and pig), has been estimated as 9.92 ± 2.37 Tg. The key species (cattle, buffalo, sheep and goat) are contributing about 9.14 ± 2.21 Tg of methane. Contribution of enteric fermentation is about 8.97 ± 2.22 Tg and manure management practices is 0.95±0.15 Tg. In India, the states of Andhra Pradesh, Bihar, Madhya Pradesh, Maharashtra, Rajasthan and Uttar Pradesh are having major share of about 5.8 Tg of methane and are considered to be hotspot of methane emission due to high number of animals. Mizoram, Goa, and Sikkim are lowest methane producers. There is reduction in the population of livestock during the year 1992-1997 which may be due to mechanization of agriculture, slaughtering, the tendency of farmers to keep more productive crossbred animals, drought, etc. There is need for the further refinement of emission factor by extensive and well-calibrated experimentation by including all potential livestock source categories. There is also a need to study manure management systems practiced in different parts of India for their methane and nitrous oxide generation potential. As the livestock contributes to the national economy, food security and social needs of the nation, the main emphasis should be on technological options for reducing rumen fermentation and increase the efficiency and utility of livestock by improving in fodder quality.
Acknowledgements
The authors are grateful to Ministry of Environment & Forests, GOI and M/s Winrock International India for their financial assistance under NATCOM. Thanks are also due to Dr. Vikram Kumar, Director NPL, Dr. Krishan Lal, Ex. Director NPL, Dr. N. Sharma Director NDRI Karnal, Dr. T. Ramasami, Director CLRI Chennai, Shri S.C. Garg, head RASD NPL and Dr. A.K. Sarkar, Ex. head Analytical Chemistry Section NPL for their encouragements and support. Dr. V.K. Singh Director Central Sheep and Wool Research Institute Avikanagar, Rajasthan for his valuable reports and Dr. P.S. Pathak, Director, Indian Grassland & Fodder Research Institute, Jhansi, UP for useful discussions are acknowledged.
References
- Garg A, Bhattacharya S, Shukla PR, Dadhwal VK (2001) Regional and Sectoral assessment of greenhouse gas emissions in India. Atmos Environ 35: 2679- 2695.
- Garg A, Shukla PR (2002) Emission Inventory of India. Publi: Tata Mc Graw Hill. New Delhi.
- Baldwin RL, Allison MJ (1983) Rumen metabolism. J of Anim Sci 57: 461-477.
- Anon (1999) Basic Animal Husbandry Statistics. AHS Series 7, Deptt of Animal Husbandry & Dairying, Ministry of Agriculture, Govt of India, Krishi Bhavan, New Delhi.
- Nivsarkar AE, Vij PK, Tantia MS (2000) Animal Genetic Resources of India Cattle and Buffalo. ICAR, New Delhi.
- Acharya RM (1992) Goat genetic resources and their management. In: Research on Goats: Indian Experience, Central Institute of Research on Goats, Makhdoom, Mathura-14. Agricultural Research data book, 2001. ICAR, New Delhi.
- Arora CL (1992) Proc organized goat breeding and breeding strategies. In: Research on Goats: Indian Experience. Central Institute of Research on Goats, Makhdoom, Mathura-14.
- Mitra AP (Ed.) (1992) Green House Gases Emission in India:1991 Methane campaign, Report No.2, CSIR, New Delhi.
- Mitra AP (Ed.) (1992) (b) Green House Gases Emission in India: 1992 Update. Report No. 4. CSIR, New Delhi.
- Swamy M, Ramasami T (1997) Methane emission from India through enteric fermentation: An estimate In Proc IGBP symposium on changes in global climate due to natural and human activities (suppl) 15-17, Allied Publishers Ltd, New Delhi, 24-26.
- IPCC (1996) Report of the 12th session of the Intergovernmental Panel on Climatic Change. Mexico City, September 11-13.
- Krishna N, Rama Prasad J, Reddy V (1997) Proc: Small Ruminant Production and PostProduction System - Current Status and Development, Chennai 94- 130.
- Ranjhan SK (1993) Animal nutrition in tropics. Vikas Publishing House, New Delhi.
- Gupta Prabhat K, Jha AK, Koul S, Sharma P, Pradhan V, et al. (2004) CH4 and N2O emission from bovine manure management practices in India. Curr Sci .
- Ranjhan SK, Sen KC, ray SN (1999) Nutritive values of Indian cattle feeds and feeding of animals. ICAR Pub, ICAR, New Delhi.
- Kearl LC (1982) Nutrient requirement of ruminants in developing countries. International feedstuff Institute, Utah State University, Logan, Utah.
- NDRI (2002) Final report of the project "Uncertainty reduction in methane and nitrous oxide from livestock sector" submitted to Winrock International India, New Delhi.
- Ranjhan SK (2001) Animal Nutrition in Tropics, Table 16-1 to 16-5. Vikas Publishing House, New Delhi.
- Mitra AP (1996) Greenhouse gas emissions in India, 1996 Update, Scientific report No. 11, Centre for Global Change, National Physical Laboratory, and New Delhi.
- Singh GP, Mohini M (1996) Methane production by Indian ruminant livestock, Curr Scie 71: 580-582.
- Singh GP (1998) Methanogenesis and production of green house gases under animal husbandry system. Report of AP Cess Fund Project, National Dairy Research Institute, Karnal
- Singh GP (2001) Livestock production and environmental protection. Lead Paper Proc. X Animal Nutrition Conference, National Dairy Research Institute, Karnal.
- Yamaji K, Toshimasa O, Akimoto H (2003) A country -specific, high-resolution emission inventory for methane from livestock in Asia.
- Ranjhan SK (1990) Agro-Industrial By-products and Non-conventional Feeds for Livestock Feeding. ICAR, New Delhi.
- Leng RA (1991) Improving Ruminant Production and Reducing Methane Emissions from Ruminants by Strategic Supplementation, US EPA.
- Burman K, Mohini M, Singhal KK (2001) Effect of Supplementation of Rumensin and Level of Roughages on Methane Production. Ind J Anim Nutri 18: 325-329.
- Moss AR (1994) Methane production by ruminants - Literature review of I. Dietary manipulation to reduce methane production and II. Laboratory procedures for estimating methane potential of diets. Nutrition Abstracts and Reviews (Series B) 64: 786-806.
- Van Nevel CJ, Demeyer DI (1992) Influence of antibiotics and a deaminase inhibitor on volatile fattyacids and methane production from detergent washed hay and soluble starch by rumen microbes in vitro Anim Feed Sci Tech 37: 21-31.
- Armstrong DG, Gilbert HJ (1985) Biotechnology and the rumen. J of the Sci of Food and Agriculture 36: 655-656.
- Natrajan I (1998) Demand forecast for biofuels in rural household. Proc. "Biomass energy data analysis and trends", France 23-24 March, Paris.
Citation: Jha AK, Singh K, Sharma C, Singh SK, Gupta PK (2011) Assessment of Methane and Nitrous Oxide Emissions from Livestock in India. J Earth Sci Climat Change 1: 107. Doi: 10.4172/2157-7617.1000107
Copyright: ©2011 Jha AK, et al. This is an open-access article distributed under the terms of the Creative Commons Attribution License, which permits unrestricted use, distribution, and reproduction in any medium, provided the original author and source are credited.
Share This Article
Open Access Journals
Article Tools
Article Usage
- Total views: 17671
- [From(publication date): 7-2011 - Apr 23, 2024]
- Breakdown by view type
- HTML page views: 12805
- PDF downloads: 4866