Research Article Open Access
Monitoring of Traffic and its Impact on Environment Using Geospatial Technology
Pavan Kumar and Vandana Tomar*Department of Remote Sensing, Banasthali University, Tonk, Rajasthan-304022, India
- *Corresponding Author:
- Vandana Tomar, M.Tech
Department of Remote Sensing
Banasthali University, Tonk
Rajasthan-304022, India
Tel: +91-8087206293
E-mail: vandana7232@gmx.com
Received date: September 26, 2012; Accepted date: January 23, 2013; Published date: January 25, 2013
Citation: Pavan Kumar, Vandana T (2013) Monitoring of Traffic and its Impact on Environment Using Geospatial Technology. J Ecosys Ecograph 3:123. doi:10.4172/2157-7625.1000123
Copyright: © 2013 Pavan Kumar, et al. This is an open-access article distributed under the terms of the Creative Commons Attribution License, which permits unrestricted use, distribution, and reproduction in any medium, provided the original author and and source are credited.
Visit for more related articles at Journal of Ecosystem & Ecography
Abstract
Travel today is relatively faster and people across the world are travelling more than ever before. Its demand regarding forecast is an essential part of transportation planning in order to evaluate future needs of an urban area. Population growth, development of the mega cities and their impacts on urban traffic are the most important problems of the metro cities. The toxic vehicular exhausts are a source of considerable air pollution. Over increasing traffic density posed continued threat to ambient air quality and responsible for producing agents of health hazards. Geospatial technology provides the smartest way to solve these problems as it can cover a large area in a fraction of time. The present study focuses on the identification of traffic intensities and noise level measured at selected traffic sites in the Varanasi city. Noise levels recorded in the city, are much higher than the permissible level and are likely to causes associated health and psychological illnesses to nearby inhabitant. The present paper describes the traffic impact on environment of Varanasi, Uttar Pradesh, India for the year 2008.
Keywords
Geospatial techniques; Population growth; Traffic
Introduction
The major problems that attracted the researchers during the past years are increasing traffic in urban and sub-urban areas [1]. Traffic congestion can be detected in sequences of optical images in different ways. Trying to detect each individual vehicle and then to estimate its velocity does not sound a good approach [2]. This theoretical vehicle density is directly related to the average vehicle velocity on the road segment and thus the information about the traffic situation, e.g. the existence of congestion, the beginning and end of congestion, the length of the jam, actual travel time, and so on can be derived [3]. Exposure to pollutants is elevated in built-up areas with high traffic volumes and heavily travelled highway corridors [4,5]. High levels of vehicle-related emissions have been correlated to high compactness traffic sites [6]. Street canyons (streets lined with tall buildings that impede the dispersion of air pollutants) and areas very close to busy roads typically have a high concentration of emissions [7-9]. A number of studies suggested that the effect size from exposure to traffic-related pollution is greater among the elders than other age groups [10,11]. These individuals are also likely to have pre-existing illness and have been subjected to a lifetime of exposure.
Cyber infrastructure includes an incorporated network of data stores, sensors and computers. It is an interdisciplinary concept, which functions as an infrastructure for long-term scientific analysis. It works for integration of massive data sets, which can be managed, with fewer efforts and less work force. It allows the addition of heavy amounts of data sets and models from different information sources. Cyber infrastructure supports data format translations due to which the information sources can have their own data representational format and data access policy. It does not appease the restrictions placed on the use of the data by its original creator. Laser based systems can be used for counting, classifying and measuring the speed of vehicles. Laser based systems offer reliability and durability. Passive infrared detectors do not transmit energy but instead use an energy sensitive photon detector located at the optical focal plane to measure the infrared energy emitted by objects in the detector’s field of view.
Population growth, development of the mega cities and their impacts on urban traffic are the most important problems and urbanization is one of the major problems. Urbanization also is defined by the United Nations as movement of people from rural to urban areas [12]. The process of urbanization basically can be caused by three factors: natural population increase, rural-urban migration, and annexation [13,14]. Increasing traffic volume and air pollution leads to health problem. Today the world has adopted the smarter techniques to solve the problems. Geospatial techniques that are conjunction of Remote Sensing (RS) and Geographic Information System (GIS) provide a synoptic view of the earth or its large area in less time. RS provide an estimation of residential population more frequently, as an increasing amount of space-borne satellite data is available [15-20]. Land use/Land cover (LU/LC) classification technique helps in the identification of area of being more focus and the noise level model is being used to measure the level of noise due to traffic. Traffic congestion is a road condition characterized by slower speeds, longer trip times, and increased queuing. It occurs when roadway demand is greater than its capacity. A period of extreme traffic congestion is colloquially known as traffic jam.
Varanasi is the oldest and ethnically rich city of the world. Its ancient buildings and old roads have stood since ages but are unable to support the exponentially growing traffic since last few decades. At many places, traffic is generally organized, flowing in lanes of travel for a particular direction, with junctions, intersections, interchanges, traffic signals, or signs. Traffic may be separated into classes: vehicular, non-vehicular (e.g. bicycles); and pedestrian. Different classes may share speed limits and easement, or may be segregate. Some countries may have very detailed and complex traffic law while others rely on drivers’ common sense and willingness to cooperate. Varanasi is a heavily populated city. Being place of tourist attraction coupled with pre-developed colonies and civil amenities, it is constrained with huge challenges in keeping pace with present and future requirements of this ancient city. Traffic congestion is a common scene in the entire city. At certain places, this problem is most severe like Andhrapul, Chaukaghat, Padeypur, Lahartara, and Rajghat. There are many routes, which allow only one-way traffic movement.
Materials and Methods
Study area
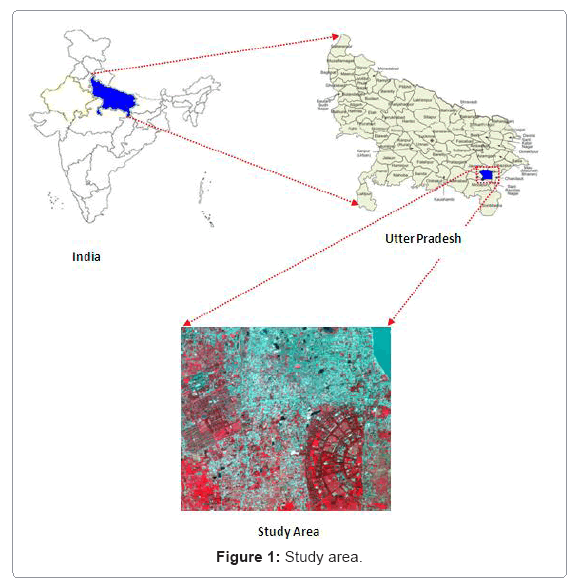
Varanasi city lies between the 25°14’ to 25°23.5’ N latitude and 82°56’ to 83°03’ E longitude (Figure 1). The environment of the town is tropical with temperature ranging from 5 °C in winter to 45 °C in summer. The mean annual rainfall lies between 680 mm to 1500 mm with a large proportion of its occurring during the months of July to September. The site selected for the survey was made to ensure coverage to the entire city, uniform spatial coverage and key locations from the point of view of commercial importance. The selected sites were: Lanka, Godowlia, Lahurabeer, and Cantonment. These are the important points of Varanasi and the problem of traffic congestion is prevalent at these points.
Data and analysis
LANDSAT satellite images of the study area were acquired in theyear 2008. These were obtained from the Global Land Cover Facility (GLCF), an Earth Science Data Interface. Details of the data have been presented in Table 1. The spatial data consisting of Survey of India toposheet and satellite imagery were used after preprocessing [21]. Digital image-processing techniques were applied to obtain relevant information including identification of classes and features.
| Particulates | |
|---|---|
| Satellite | LANDSAT |
| Sensor | MSS/TM |
| Band combination | 4,3,2 |
| Spatial Resolution | 30 m |
| Year | 2008 |
Table 1: Description of satellite data used data.
The first step was to design the geodatabase according to the information. After the geodatabase design, we started to get all the datasets. The raw data sets were put through the different analysis tools in Arc Toolbox for the required data. After the geodatabase creation, different tools in ArcMap were used to optimize the information. Digital image analysis was carried out using ERDAS IMAGINE 11 and ArcGIS 10 software package. All the spatial data in the form of maps were transformed into computer readable digital maps. These digital maps were imported into PCI Geomatica 10 to perform optimum enhancement and then into ERDAS IMAGINE 2011 for further analysis. Based on the brief reconnaissance survey with additional information from previous research in the study area, a classification scheme was developed for the study area [22].
Measurement of noise levels
Noise level monitoring was conducted in free flowing traffic condition between 10.00 AM and 12:00 PM every five days, excluding holidays and festivals that can modify the general traffic conditions at each site. In total, five measurements per site were made. As traffic, density was recorded during the monitoring period by counting the number of vehicles passing a reference line on the road. The noise measurement was done at 1.5 m height at a distance of 5.0 m from the outer edge of the road as shown in Table 2. To monitor noise levels at selected sites, sound level meter was used. Sound level meter comprises of a non-directional microphone coupled to an amplifier to transform sound pressure level impinging on the atmosphere of a proportional electric signal indicated by a meter. Standard of noise for heavy city traffic is 85 dB. Total numbers of vehicles passing by were estimated by actually counting the number of vehicles passing through an imaginary line on the road for ten minutes and then taking the average.
| Site | Noise on road (dB) | Noise at residential area nearest road (dB) |
|---|---|---|
| Lanka | 90.4 | 68.6 |
| Cantt | 103.3 | 69.15 |
| Godowlia | 104.2 | 67.4 |
Table 2: Noise at 3 sites of Varanasi (11.00 AM).
Land use/Land covers type
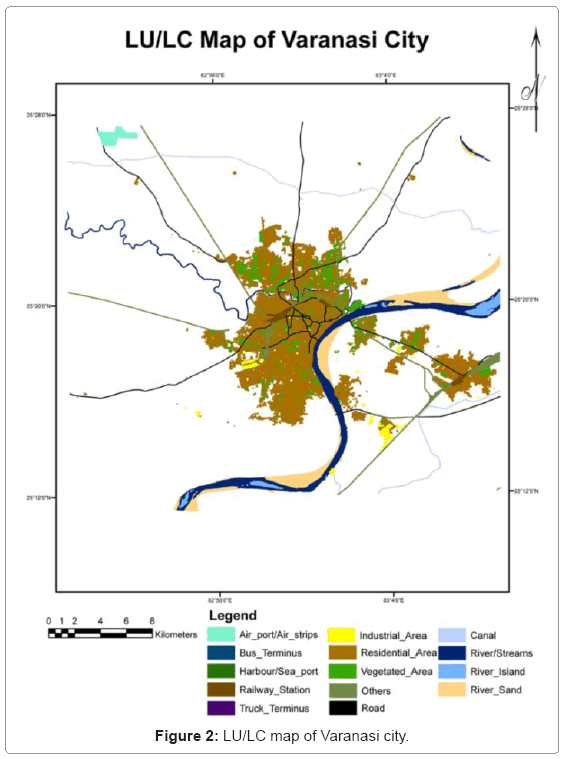
The classification scheme developed gives a broad classification where the land use land cover was identified by a single digit. Various supervised classification algorithms were used to assign an unknown pixel to one of a number of classes. Supervised classification was carried out for generating land use and land cover map of study area. The classified LU/LC map of the study area is shown in Figure 2.
Transportation in study area
GIS is progressively more important in customizing and integrating a broad range of exploratory data. There are three national highways i.e. NH-2, NH-56 and NH-29 and four state highways i.e. SH-82, SH-21, SH-24 and SH-98 passing through the heart of the city. These National Highways and state highways have high passenger traffic as these roads provide a good connectivity to the surrounding areas in the Uttar Pradesh state as well as two metropolitan cities that are Delhi and Kolkata. Transportation and road map were shown in Figure 3.
Results and Discussions
Varanasi is a heavily populated city. The major issues contribute in traffic congestion are auto rickshaw and cycle rickshaw pullers which cause inconvenience to traffic by stopping here and there. The fact is that only 2600 auto rickshaws are permitted in the city but the actual scenario is that around 28,000 auto rickshaws run in the city. The other situations are narrow and damaged roads and people unaware of traffic rules which also causes to the sudden accidental situations too. As the city has ethnic existence, it attracts the large number of tourists. At few places additional to the selected sites, this problem is severe like Andhrapul, Chaukaghat, Padeypur, Lahartara and Rajghat. As a result, levels of air pollutants in the city are high, often crossing the maximum permissible limits (National Ambient Air Quality Standards). Most significant air pollutants are Respirable Suspended Particulate Matter (RSPM), however, concentration of secondary pollutant ozone is also continuously escalating.
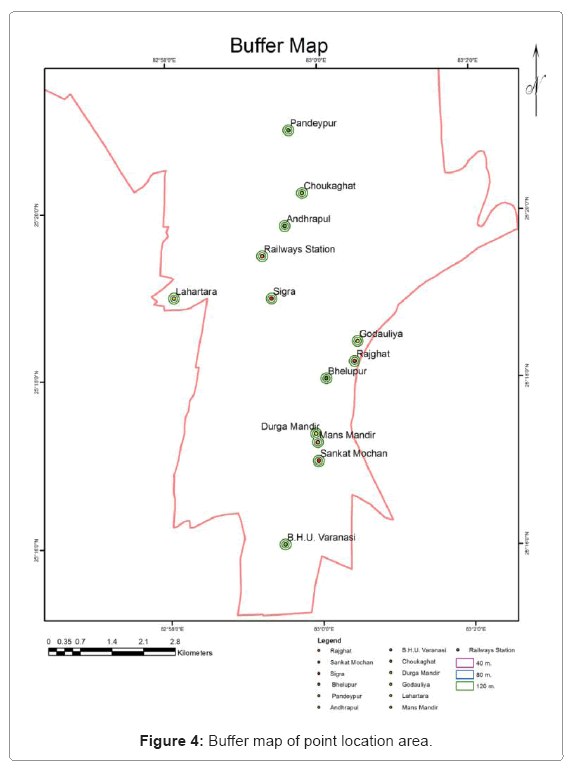
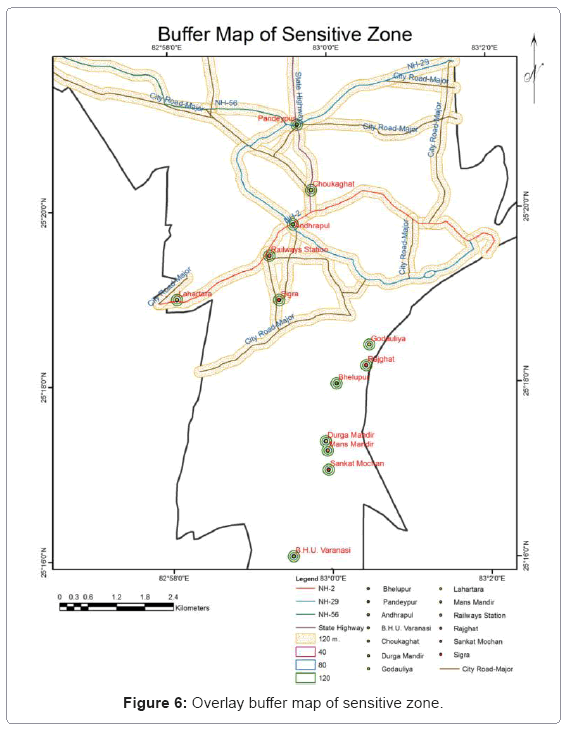
The toxic vehicular exhausts are source of considerable air pollution. The over increasing vehicular traffic density posed continued threat to the ambient air quality and is responsible for causing many health hazards. Around 50% of the pollutants emitted into the air daily come from automobile exhaust, which mainly contains carbon monoxide, oxides of Nitrogen, Hydrocarbons, Sulphur dioxide and Lead. Different point locations of area like Sigra, Lahartara, Andhrapul, Pandeypur, Rajghat, Godowlia, Chaukaghat, Railway station, Durga Mandir, Manas Mandir, Sankat Mochan Mandir and Banaras Hindu University were identified and made buffer of each point location. Point areas that come under 40 m buffer zone, are show maximum hazardous effects on people than 80 and 120 m buffer zone (Figure 4).
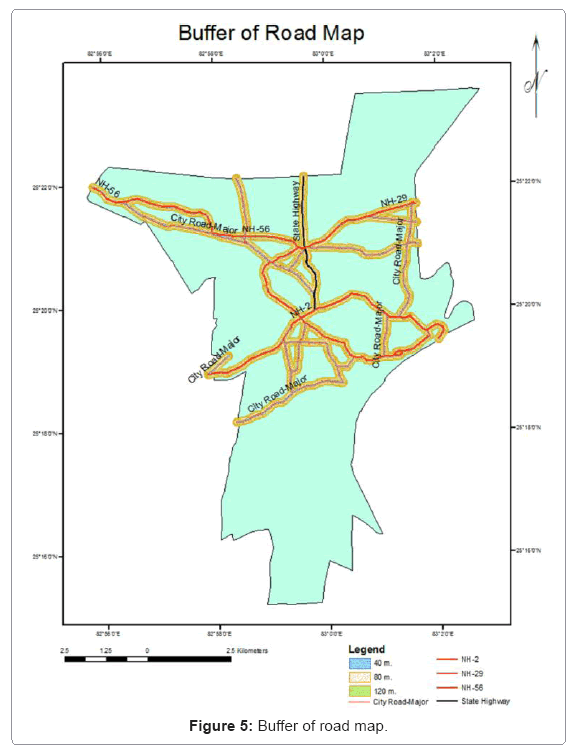
The main railway station of Varanasi is located in Cantt from where large numbers of people travel in and outside Varanasi. A large queue of auto rickshaws and rickshaws can be seen at this place. Intercity buses, trucks and other four-wheelers and two-wheelers take this route and make this place heavily congested. Encroachment by vendors on both sides of the road can also be seen. Figure 5 indicates road buffer zone at 40, 80 and 120 m. The more sensitive areas comes under 40 m buffer zone followed by 80 m. The Less sensitive areas comes under 120 m buffer zone. Major city road buffer zone and point location buffer zone were overlaid which is shown in Figure 6. Andhrapul, Pandeypur, Rajghat, Godowlia, Chaukaghat, Railway station, Lahartara and Sigra have indicated maximum polluted area by vehicle emitted gases.
Conclusion
The present study envisages the current scenario of traffic and its impact on environment and the people in Varanasi city. The study presents an epigrammatic survey of existing traffic and road condition monitoring using cyber infrastructure technologies. The traffic congestion caused by various factors and situation pollutes the air and produces agents responsible for health hazards. This congestion is caused by insufficient capacity and bottlenecks. The lack of pedestrian, bicycle and informal public transport (auto rickshaws, taxi and private buses) contributes to more than 30% of the traffic congestion. Improvement in the management can lead to saving of time and effectively lessen the congestion and jams. Some tactics should be used to aware the people about traffic rules and consequences of the pollution caused by traffic. The traffic congestion contributes to air and noise pollution which effects more on the communities living around the main roads and places.
Two sections of the community have to withstand the worst of unrestricted ingress of two, three and four wheelers. Slum dwellers face the pollution from the motorized vehicles while pedestrians face the threat of being killed or injured by poor management of vehicles. Comprehensive inspection and maintenance policy to ensure minimum quality of life is inconceivable in the foreseeable future. Whatever has come as sporadic norms can probably not be forced upon. Observance of the policy cannot be assumed from the top. So there is need of the awareness form the root level i.e. citizens.
Acknowledgements
We are grateful to Prof. Madhoolika Agrawal and Miss Divya Pandey, Department of Botany, Banaras Hindu University (B.H.U.), Varanasi-221005, India for their cooperation and valuable suggestion. We are thankful to Department of Botany, B.H.U, India for providing all necessary support. We are also thankful to Department of Remote Sensing, Banasthali Vidyapith, Tonk, Rajasthan-304022, India for providing lab facilities support.
References
- Gintautas Palubinskas, Franz Kurz, Peter Reinartz (2008) Detection of traffic congestion in optical remote sensing imagery. Proc. of IEEE International Geoscience and Remote Sensing Symposium (IGARSS'08), 7-11 July, 2008, Boston, USA, IEEE.
- Reinartz P, Lachaise M, Schmeer E, Krauss T, Runge H (2006) Traffic Monitoring with Serial Images from Airborne Cameras. ISPRS Journal of Photogrammetry and Remote Sensing 61:149-158.
- Kockelman KM (1998) Changes in the Flow-Density Relation due to Environmental, Vehicle, and Driver Characteristics. Transportation Research Record 1644: 47-56.
- Peace H, Owen B, Raper DW (2004) Identifying the contribution of different urban highway air pollution sources. Sci Total Environ 334-335:347-357.
- Zeka A, Zanobetti A, Schwartz J (2005) Short term effects of particulate matter on cause specific mortality: effects of lags and modification by city characteristics. Occup Environ Med 62: 718-725.
- Campbell ME, Benson BA, Muir MA (1995) Urban air quality and human health: a Toronto perspective. Can J Public Health 86:351-357.
- Hoek G, Meliefste K, Cyrys J, Lewne M, Bellander T, et al. (2002) Spatial variability of fine particle concentrations in three European areas. Atmospheric Environment 36: 4077-4088.
- Kaur S, Clark RDR, Walsh PT, Arnold SJ, Colvile RN, et al. (2006) Exposure visualisation of ultrafine particle counts in a transport microenvironment. Atmos Environ 40: 386-98.
- Longley ID, Gallagher MW, Dorsey JR, Flynn M, Bower KN, et al. (2004) Street canyons aerosol pollutant transport measurements. Sci Total Environ 334-335: 327-336.
- Goldberg MS, Burnett RT, Brook J, Bailar III JC, Valois MF, et al. (2001) Associations between daily cause-specific mortality and concentrations of ground-level ozone in Montreal, Quebec. Am J Epidemiol 154: 817-826.
- Pope CA III (2000) Epidemiology of fine particulate air pollution and human health: biologic mechanisms and who’s at risk? Environ Health Perspect 108: 713-723.
- United Nations (2009) World Urbanization Prospects. The 2009 revision. New York.
- Brockerhoff MP (2000) An urbanizing world. Population Bulletin 55: 1-48.
- Jacquemin ARA (1999) Urban Development and New Towns in the Third World. Lessons from the New Bombay experience. Ashgate.
- Elvidge CD, Baugh KE, Kihn EA, Kroehl HW, Davis ER, et al. (1997) Relation between satellites observed visible-near infrared emissions, population, economic activity and electric power consumption. International Journal of Remote Sensing 18: 1373-1379.
- Lo CP (2001) Modeling the population of China using DMSP operational linescan system nighttime data. Photogrammetric Engineering and Remote Sensing 67: 1037-1047.
- Lu D, Weng Q, Li G (2006) Residential population estimation using a remote sensing derived impervious surface approach. International Journal of Remote Sensing 27: 3553-3570.
- Taubenböck H, Roth A, Dech S (2007) Linking structural urban characteristics derived from high resolution satellite data to population distribution. Urban and Regional Data Management: 35-45.
- Liu X, Herold M (2007) Estimating population distributions in urban areas. Urban Remote Sensin: 269-290.
- Schneiderbauer S, Ehrlich D (2007) EO data supported population density estimation at fine resolution test case rural Zimbabwe. In: Zeug, G. & Pesaresi, M. (Eds): Global Monitoring for Security and Stability (GMOSS). Integrated Scientific and Technological Research Supporting Security Aspects of the European Union, JRC Scientific and Technical Reports, EUR 23033 194 -209.
- Rani M, Kumar P, Yadav M, Hooda RS (2011) Wetland Assessment and Monitoring Using Image Processing Techniques: A Case Study of Ranchi, India. Journal of Geographic Information System 3: 345-350.
- Anderson JR, Hardy EE, Roach JT, Witmer RE (1976) A Land Use and Land Cover classification system for use with remote sensor data. Geological Survey Professional, Paper No. 964.
Relevant Topics
- Aquatic Ecosystems
- Biodiversity
- Conservation Biology
- Coral Reef Ecology
- Distribution Aggregation
- Ecology and Migration of Animal
- Ecosystem Service
- Ecosystem-Level Measuring
- Endangered Species
- Environmental Tourism
- Forest Biome
- Lake Circulation
- Leaf Morphology
- Marine Conservation
- Marine Ecosystems
- Phytoplankton Abundance
- Population Dyanamics
- Semiarid Ecosystem Soil Properties
- Spatial Distribution
- Species Composition
- Species Rarity
- Sustainability Dynamics
- Sustainable Forest Management
- Tropical Aquaculture
- Tropical Ecosystems
Recommended Journals
Article Tools
Article Usage
- Total views: 18335
- [From(publication date):
June-2013 - Aug 31, 2025] - Breakdown by view type
- HTML page views : 13438
- PDF downloads : 4897

